. 2009;77 Suppl 9(Suppl 9):29-49.
doi: 10.1002/prot.22551.

The other 90% of the protein: assessment beyond the Calphas for CASP8 template-based and high-accuracy models

Affiliations

The other 90% of the protein: assessment beyond the Calphas for CASP8 template-based and high-accuracy models

Daniel A Keedy et al. Proteins. 2009.

Abstract

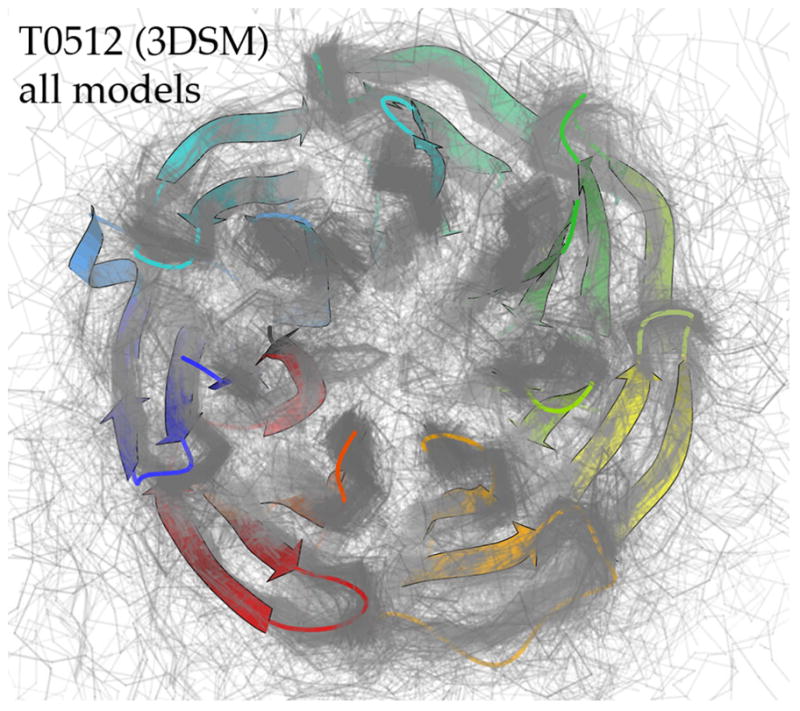
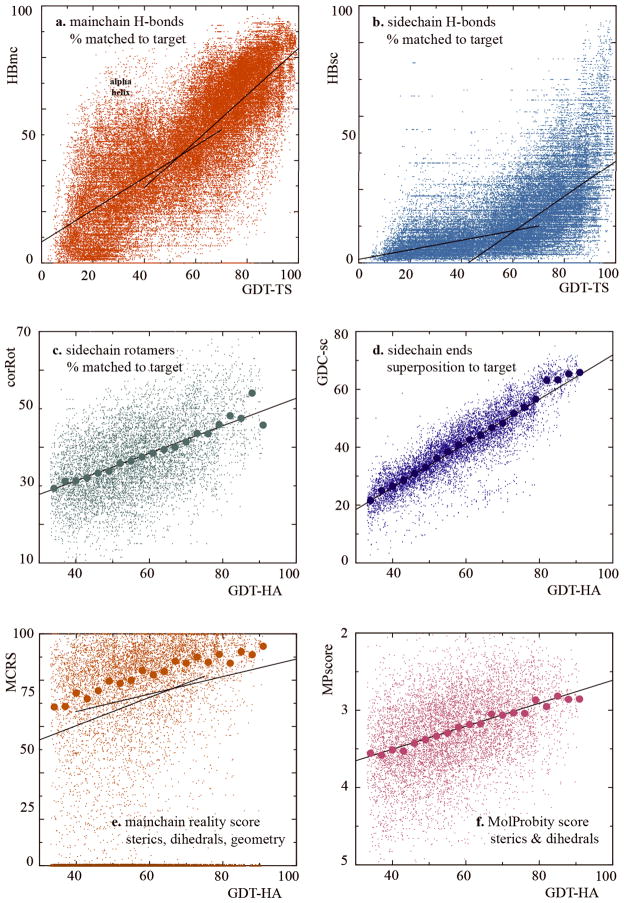
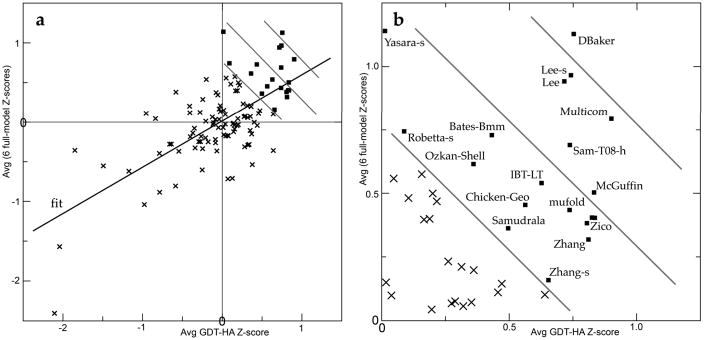
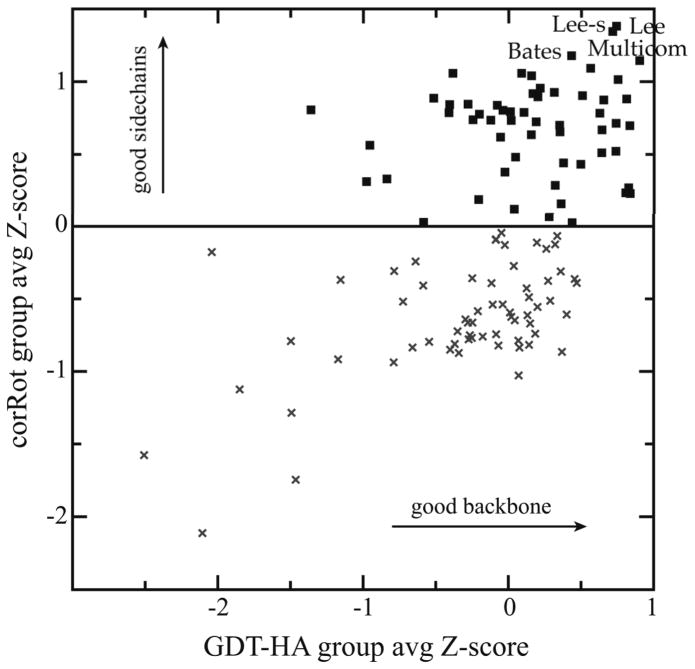
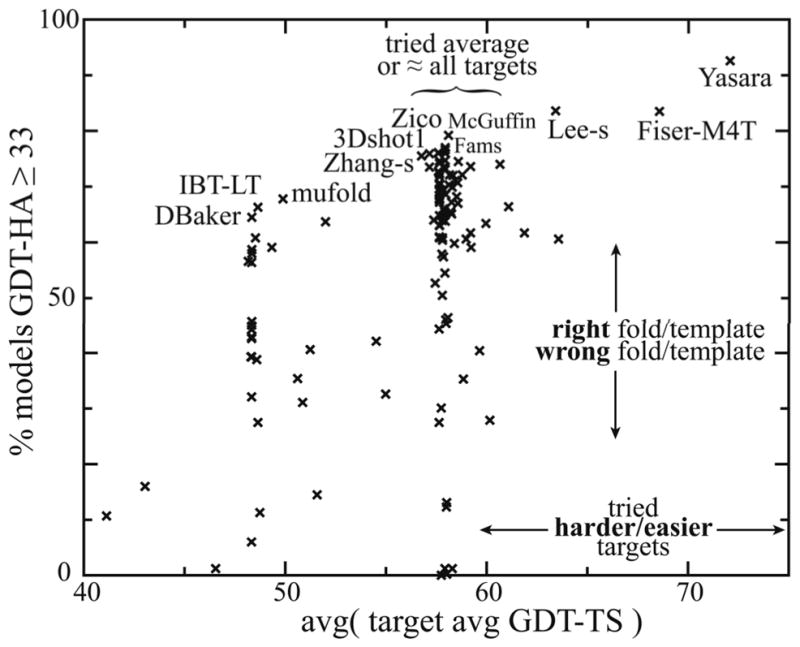
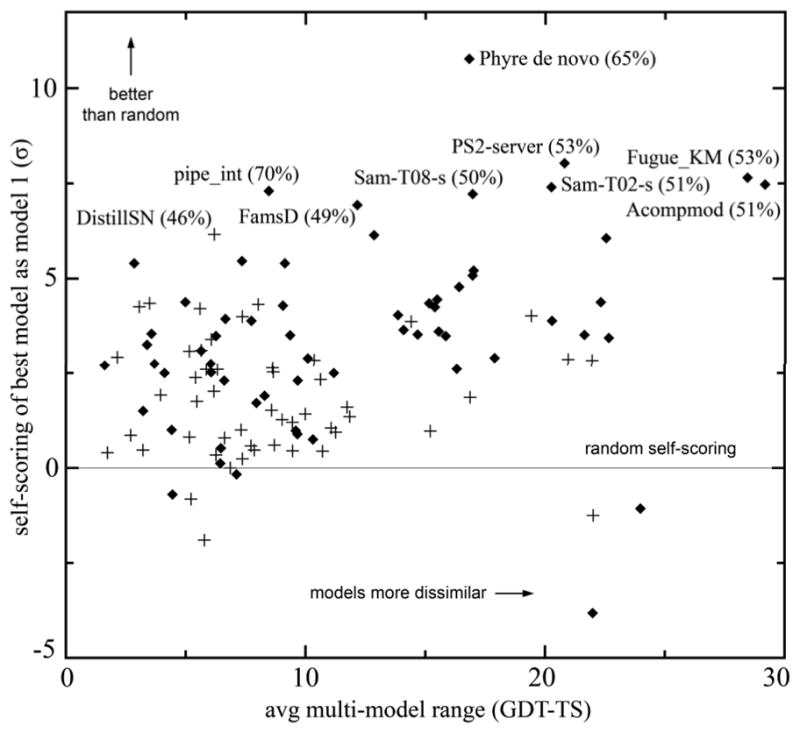
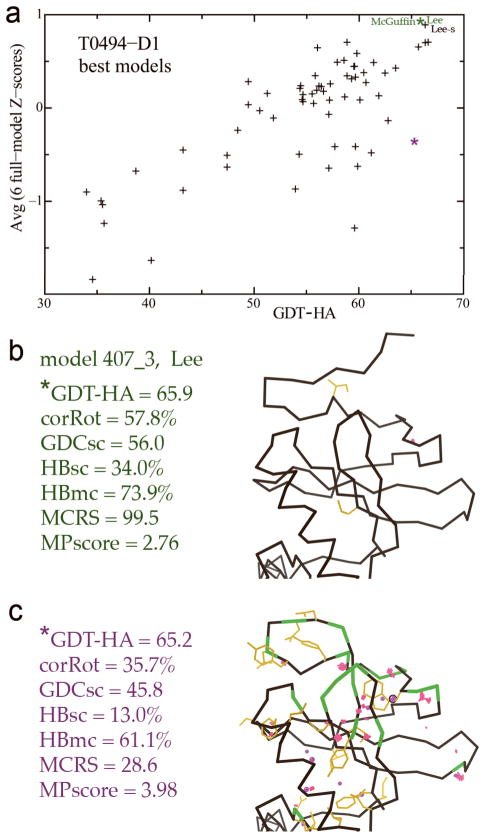
For template-based modeling in the CASP8 Critical Assessment of Techniques for Protein Structure Prediction, this work develops and applies six new full-model metrics. They are designed to complement and add value to the traditional template-based assessment by the global distance test (GDT) and related scores (based on multiple superpositions of Calpha atoms between target structure and predictions labeled "Model 1"). The new metrics evaluate each predictor group on each target, using all atoms of their best model with above-average GDT. Two metrics evaluate how "protein-like" the predicted model is: the MolProbity score used for validating experimental structures, and a mainchain reality score using all-atom steric clashes, bond length and angle outliers, and backbone dihedrals. Four other new metrics evaluate match of model to target for mainchain and sidechain hydrogen bonds, sidechain end positioning, and sidechain rotamers. Group-average Z-score across the six full-model measures is averaged with group-average GDT Z-score to produce the overall ranking for full-model, high-accuracy performance. Separate assessments are reported for specific aspects of predictor-group performance, such as robustness of approximately correct template or fold identification, and self-scoring ability at identifying the best of their models. Fold identification is distinct from but correlated with group-average GDT Z-score if target difficulty is taken into account, whereas self-scoring is done best by servers and is uncorrelated with GDT performance. Outstanding individual models on specific targets are identified and discussed. Predictor groups excelled at different aspects, highlighting the diversity of current methodologies. However, good full-model scores correlate robustly with high Calpha accuracy.


Figures

Figure 1
Figure 1
All 354 predicted models for T0512-D1. Target backbone is in ribbon representation colored blue to red in N- to C-terminal order; model Cα traces are in translucent gray. PDB code: 3DSM (NESG, unpublished).
Figure 2
Figure 2
Empirical Ramachandran distribution, one component in both MolProbity and mainchain reality scores. The data points are ϕ,ψ backbone dihedral angles for all general-case residues with maximum mainchain B-factor ≤ 30, from the Top500 quality-filtered set of crystal structures; Gly, Pro, and pre-Pro residues are analyzed separately. Contours are calculated with a density-dependent smoothing algorithm. 98% of the data fall within the favored region (inside gray contour), 99.95% within the allowed or favored regions (inside black contour), and 0.05% in the outlier region (outside black contour).
Figure 3
Figure 3
Bimodal distributions of GDT-HA and GDT-TS scores. All CASP8 TBM models were placed into 33 equally spaced bins, separately for GDT-HA and for GDT-TS. The division between “right fold” and “wrong fold” occurs at approximately GDT-HA of 33 (which we used for our later analysis) and GDT-TS of 50. Note that bimodal distributions were also observed within most individual targets (data not shown).
Figure 4
Figure 4
Distributions of the new full-model scores for individual models. Panels a–b include all models regardless of GDT, whereas panels c-f include only best models with GDT-HA ≥ 33. Dual linear fits are on models with GDT-TS < 55 vs. ≥ 55 in panels a-b and on models with GDT-HA < 60 vs. ≥ 60 in panel e; these divisions were chosen manually to highlight visible inflection points. Larger dots in panels c–f are median values for bins of 3 GDT-HA units; bins at high GDT-HA include many fewer models, producing high variability for some measures (e.g. corRot). The fit lines are well below the median points in panel e, because many points lie at zero MCRS. Note that the y-axis for MPscore in panel f has been reversed relative to other panels, because lower MPscores are better.
Figure 5
Figure 5
a) Group-average Z-score for the 6 full-model scores, plotted vs. group-average Z-score for GDT-HA. b) Close-up of the upper-right quadrant from panel a, with the groups highlighted that did well on the combined score from both axes (emphasized by the diagonal lines). Group Z-scores are averaged over best models with GDT-HA ≥ 33; groups with a qualifying model for < 20 targets are excluded.
Figure 6
Figure 6
Group-average Z-score for rotamer correctness, plotted vs. group-average Z-score for GDT-HA. The horizontal line at corRot Z-score of 0 was drawn manually to visually highlight the gap between group clusters on sidechain performance. Group-average Z-scores are for best models with GDT-HA≥ 33; groups attempting < 20 targets are excluded.
Figure 7
Figure 7
Percentage of models with roughly the “right fold”, plotted vs. difficulty of targets attempted. The percentage of all of a group’s models with GDT-HA≥ 33 (“right fold”) is on the y-axis. The average across a group’s attempted targets of all-model, all-group average GDT-TS (a measure of target difficulty) is on the x-axis. All groups attempting at least 20 targets are included. Names of several groups along the “outstanding edge” are labeled.
Figure 8
Figure 8
Ability of groups to self-select their best model as model 1. The difference from the percentage expected based on random chance (correcting for different average numbers of models) is plotted vertically (in units of standard deviations); range of scores within a group’s model sets is plotted horizontally. For the best self-scorers, the group name and the percentage of “model 1s” that were actually “best models” are shown. Diamonds indicate server groups, which dominate the top self-scorers; pluses indicate human groups.
Figure 9
Figure 9
An over-extended β-strand, with main-chain bond-length outliers up to 40σ, marked as stretched-out red springs. T0487-D1, PDB code: 3DLB, argonaute complex.
Figure 10
Figure 10
Evaluating loop insertion models for residues 255-266 of T0438. PDB code: 2G39 (MCSG unpublished). a) Loop insertions (magenta) for the 9 distinct server models (backbone in brown) that declared the template 2G39 (blue), as compared to the actual insertion in T0438 (green) relative to 2G39. b) Correctly aligned insertion for model 002_1 with few geometry problems. c) Incorrectly aligned insertion with significant geometry problems. Red spikes are steric clashes with ≥ 0.5Å overlap of van der Waals radii, green kinks are Ramachandran outliers, gold sidechains are rotamer outliers, pink balls indicate Cβ atoms with excessive deviations from their ideal positions, blue and red springs are too-short and too-long bond lengths, and blue and red fans are too-tight and too-wide bond angles.
Figure 11
Figure 11
Two outstanding predictions for the TBM/FM target T0460-D1. a) Cα traces are shown for the target in black, for the 134/521 predicted models with LGA-S3 from 30 to 60 in peach, and for the particularly exceptional model 489_3 (DBaker) in green. PDB code: 2K4N (NESG, unpublished). b) Cumulative superposition correctness plot from the Prediction Center website. The percentage of model Cα atoms positioned within a distance cutoff of the corresponding target Cα atom after optimal LGA superposition is shown (x-axis) for a range of such distance cutoffs (y-axis); all models for T0460-D1 are shown in peach. Thus lines lower and further to the right indicate predictions that better coincide with the target. The rightmost lines are models 489_3 (DBaker, green) and 387_1 (Jones-UCL, blue).
Figure 12
Figure 12
Evaluation of relative sub-domain orientation for T0472 (PDB code: 2K49, NESG, unpublished). a) Ribbon representation of the NMR ensemble for T0472. Note the twofold pseudo-symmetry between the similar compact, sheet-to-helix bundles in the top-right and bottom-left. b) Position-specific alignment plot for the whole target T0472, from the Prediction Center website. Domain 1 is on the left, domain 2 on the right. Residues along the sequence (x-axis) are colored white, red, yellow, and green for increasingly accurate alignment. Note the top three models (y-axis), which are the only ones with good alignment in both sub-domains.
Figure 13
Figure 13
Differentiating models with equally good GDT scores, based on full-model performance for both physical realism and match to target. a) Average full-model Z-score, plotted against raw GDT-HA, on individual best models for target T0494-D1 (PDB code: 2VX3, SGC, unpublished). b) Model 407_3 (Lee) has a GDT-HA of 65.9 and the best average full-model Z-score on this target. c) Another model with essentially the same GDT-HA (65.2) has a much lower full-model Z-score, including poorer match to target sidechains and H-bonds; the six individual scores are listed. Mainchain-mainchain steric clashes, rotamer and Ramachandran outliers, and Cβ deviations are flagged in color for parts b and c, which show a representative portion of the model structures.

Similar articles

Cited by

References

    1. Kryshtafovych A, Fidelis K, Moult J. Progress from CASP6 to CASP7. Proteins. 2007;69 (Suppl 8):194–207. - PubMed
    1. Cozzetto D, Kryshtafovych AFK, Moult J, Rost B, Tramontano A. Evaluation of template-based models in CASP8 with standard measures. Proteins. 2009;(Suppl 9) - PMC - PubMed
    1. Zemla A. LGA: A method for finding 3D similarities in protein structures. Nucleic Acids Res. 2003;31(13):3370–4. - PMC - PubMed
    1. Kinch LN, Wrabl JO, Krishna SS, Majumdar I, Sadreyev RI, Qi Y, Pei J, Cheng H, Grishin NV. CASP5 assessment of fold recognition target predictions. Proteins. 2003;53 (Suppl 6):395–409. - PubMed
    1. Tress M, Ezkurdia I, Grana O, Lopez G, Valencia A. Assessment of predictions submitted for the CASP6 comparative modeling category. Proteins. 2005;61 (Suppl 7):27–45. - PubMed

Publication types

LinkOut - more resources