Review
. 2009 Aug;20(4):461-70.
doi: 10.1016/j.copbio.2009.08.006. Epub 2009 Sep 3.

Engineering multicellular systems by cell-cell communication

Affiliations
Review

Engineering multicellular systems by cell-cell communication

Anand Pai et al. Curr Opin Biotechnol. 2009 Aug.

Abstract

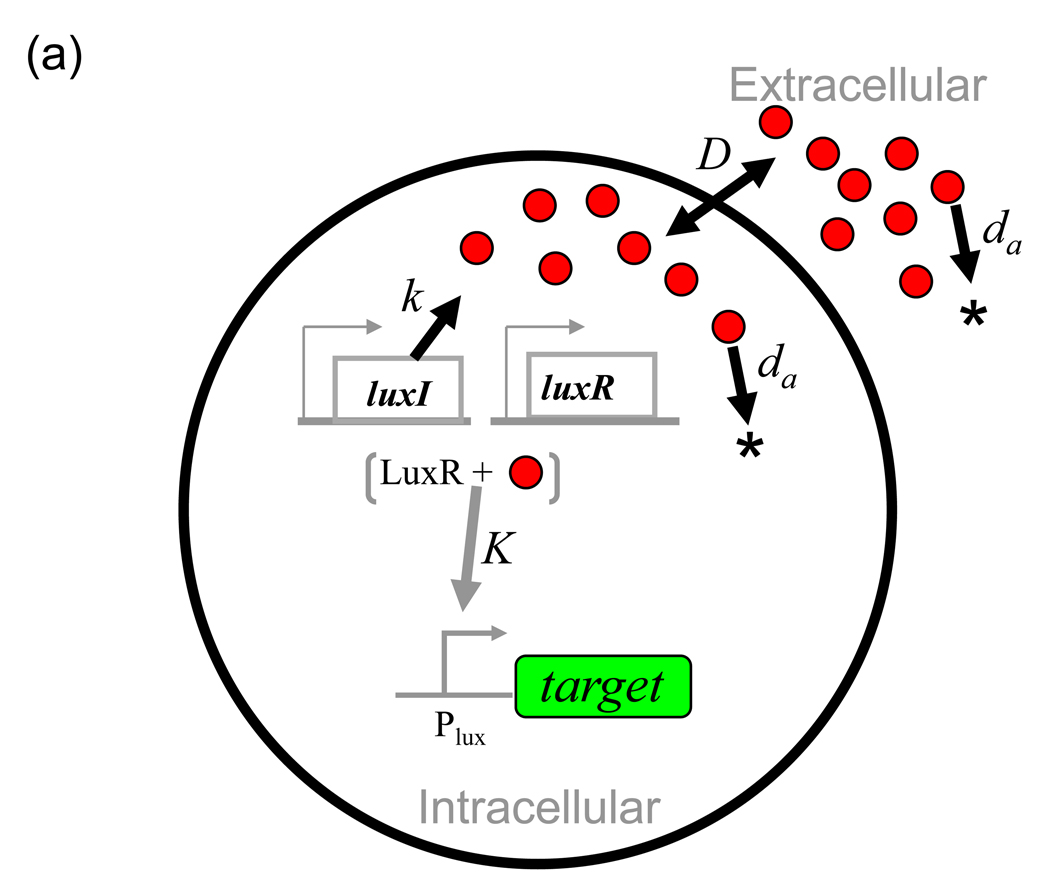
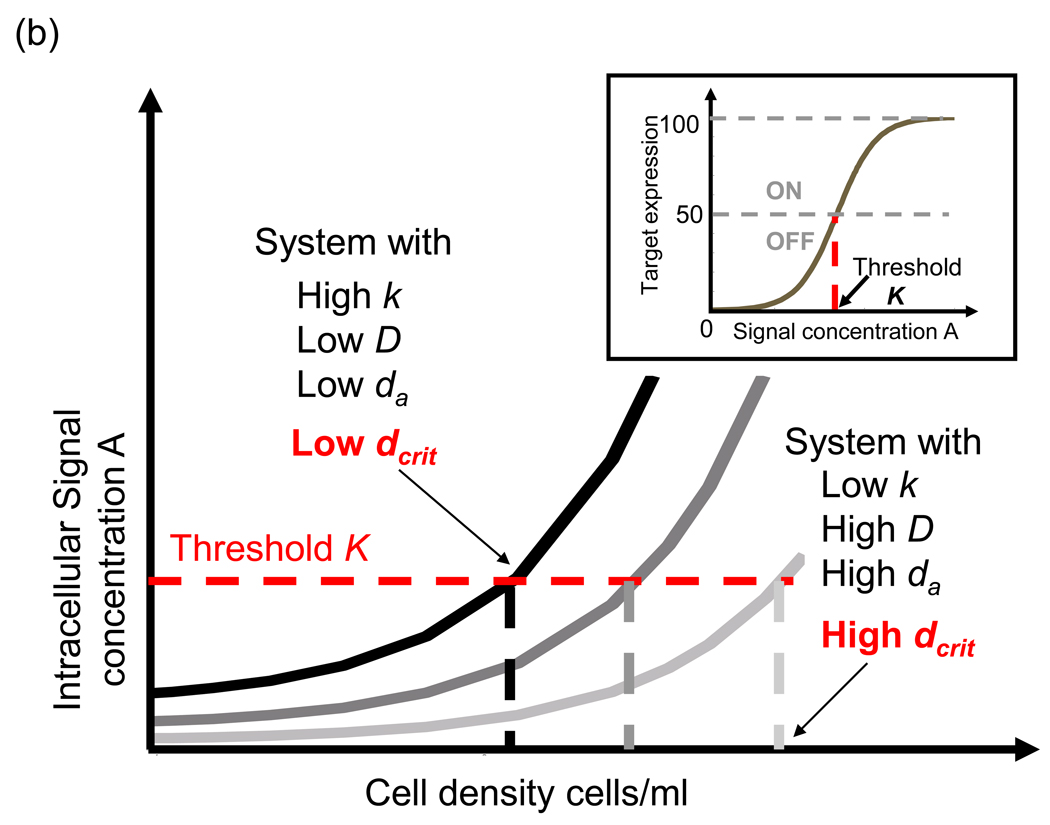
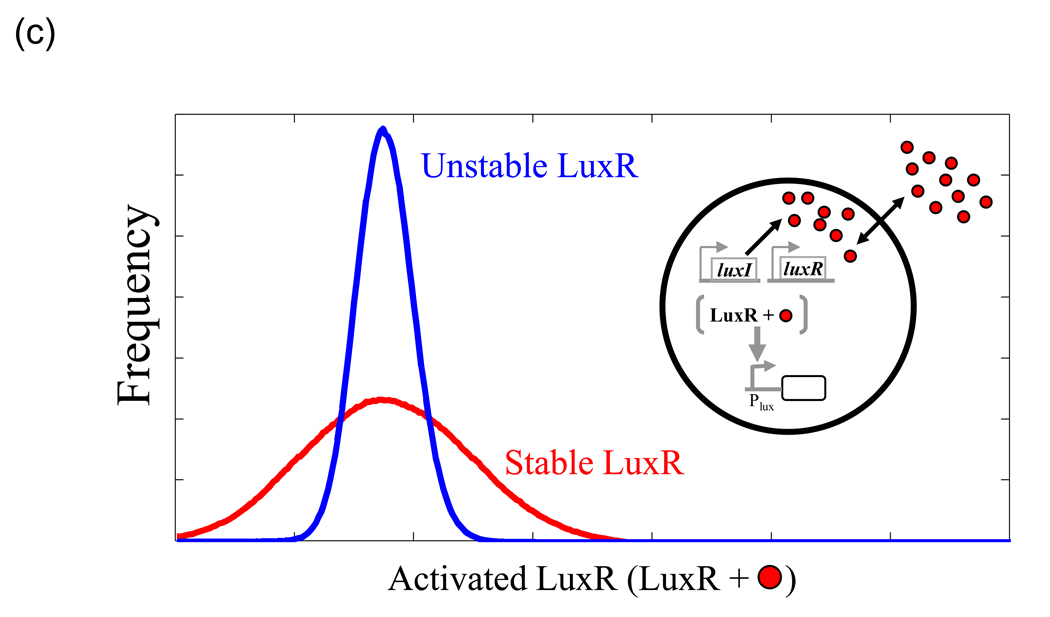
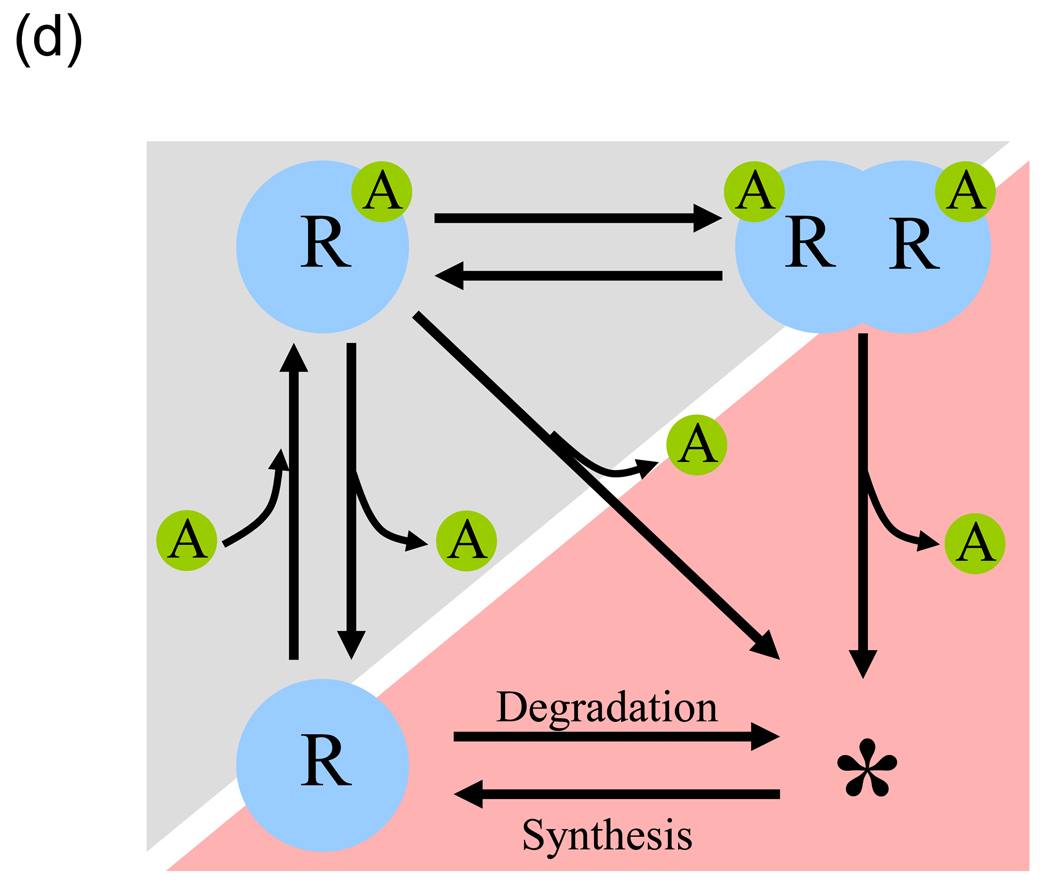
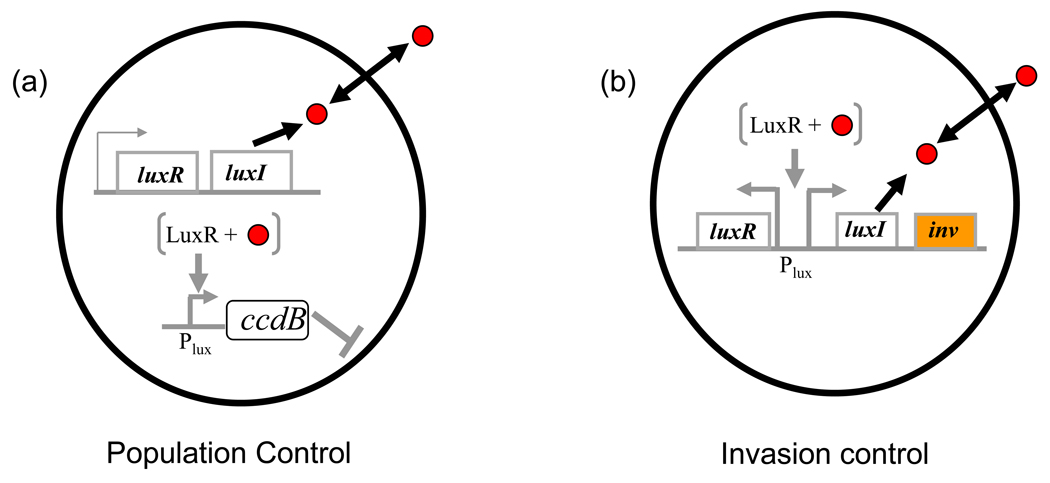
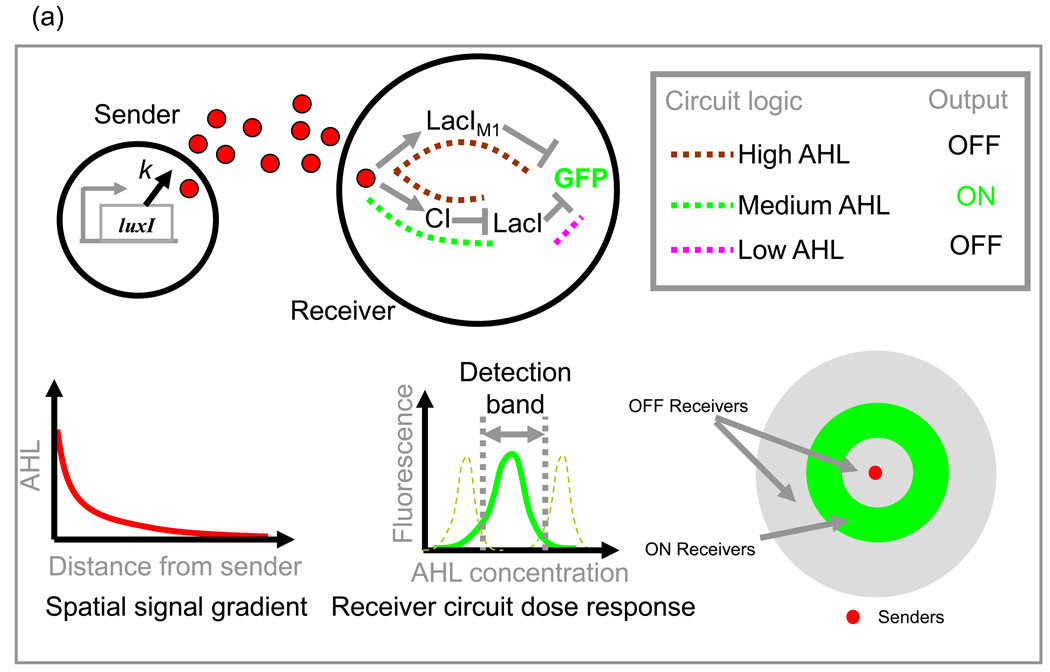
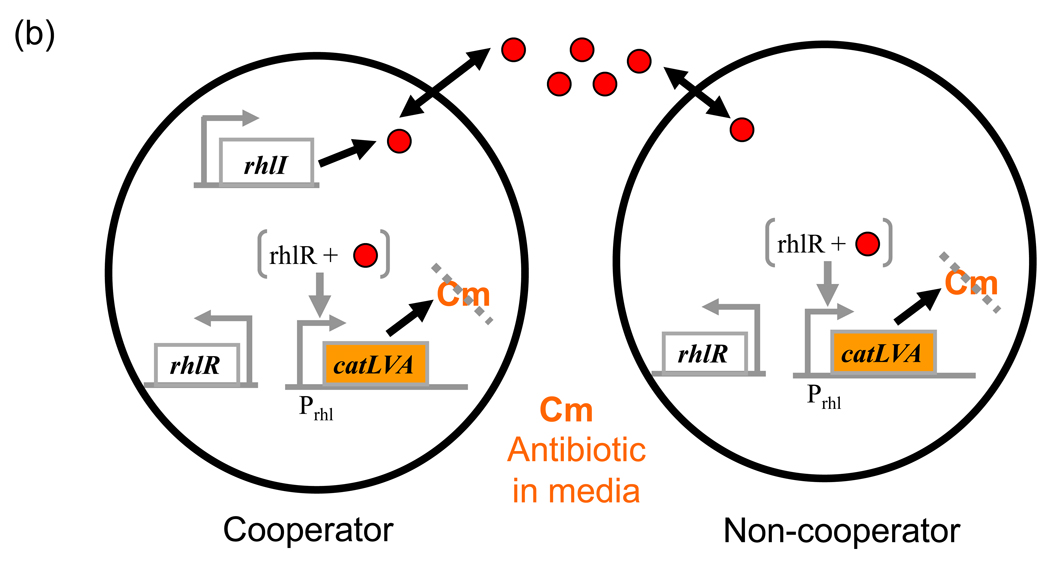
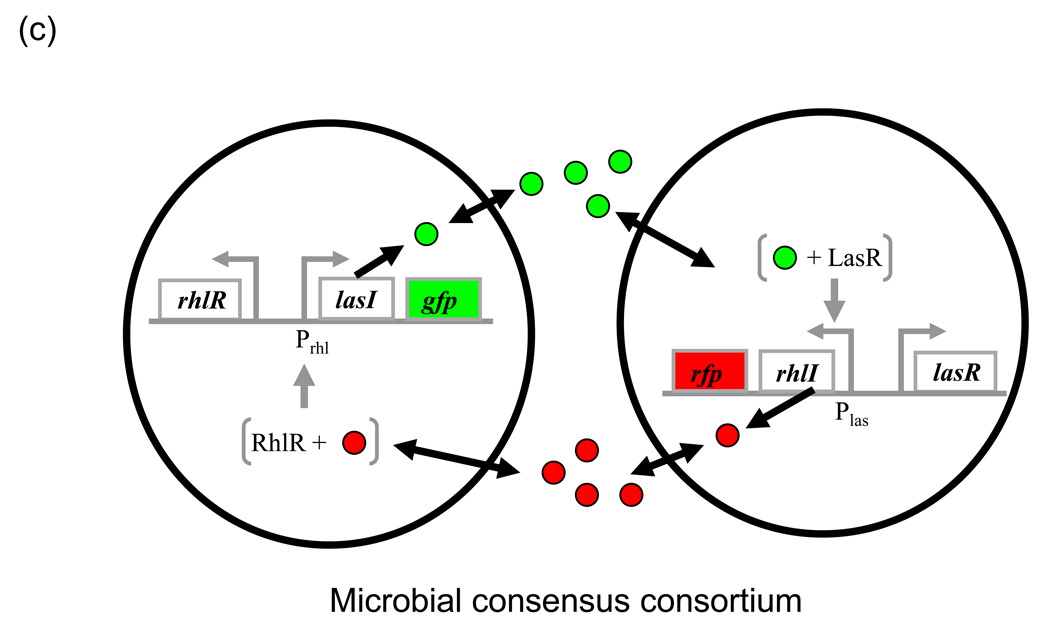
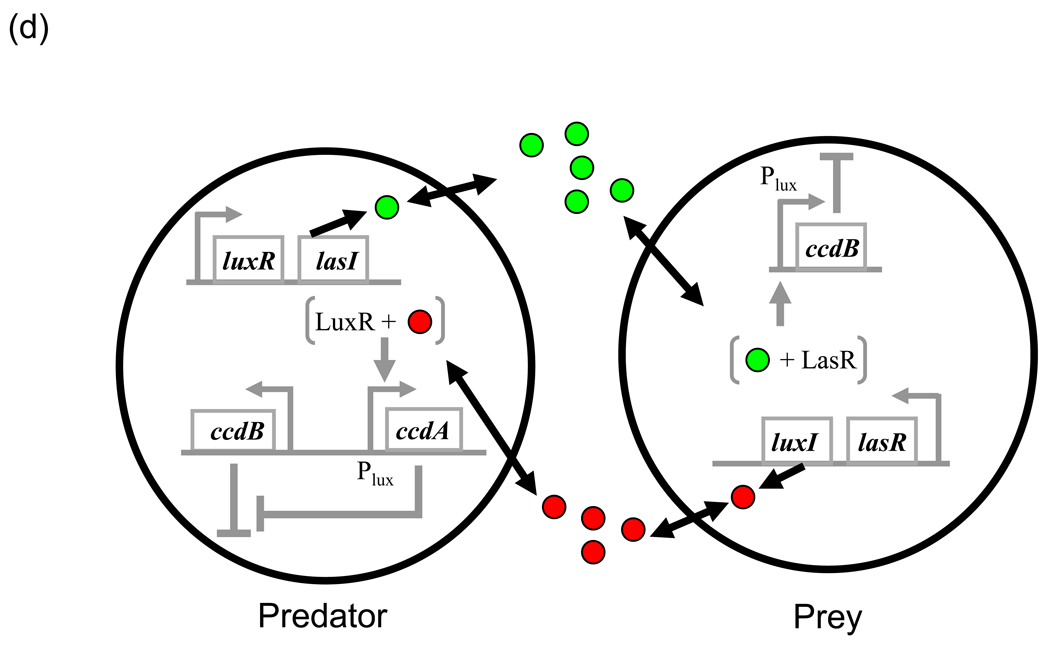
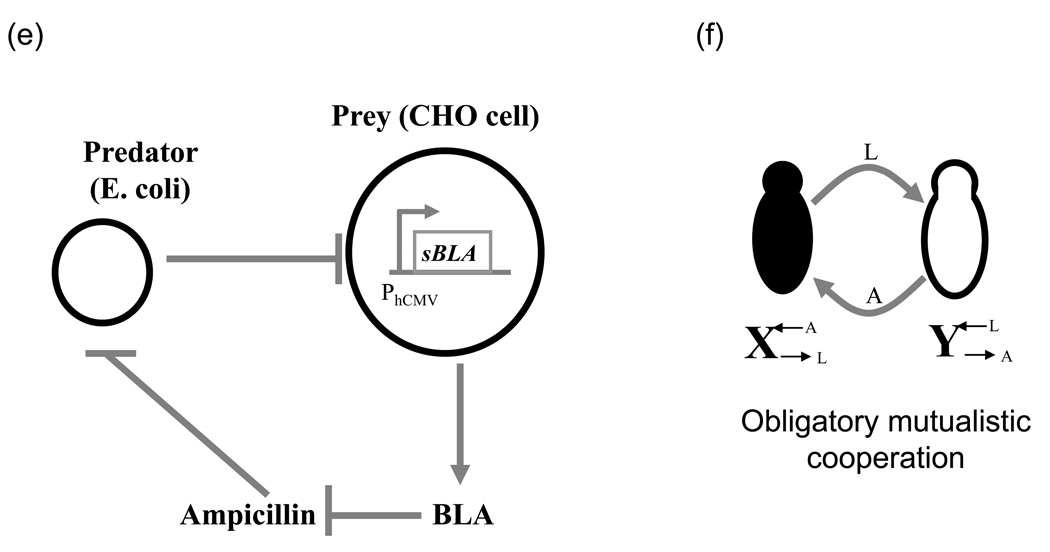
Synthetic biology encompasses the design of new biological parts and systems as well as the modulation of existing biological networks to generate novel functions. In recent years, increasing emphasis has been placed on the engineering of population-level behaviors using cell-cell communication. From the engineering perspective, cell-cell communication serves as a versatile regulatory module that enables coordination among cells in and between populations and facilitates the generation of reliable dynamics. In addition to exploring biological 'design principles' via the construction of increasingly complex dynamics, communication-based synthetic systems can be used as well-defined model systems to study ecological and social interactions such as competition, cooperation, and predation. Here we discuss the dynamic properties of cell-cell communication modules, how they can be engineered for synthetic circuit design, and applications of these systems.


Figures

Fig. 1
Fig. 1. Cell-cell communication and its properties
Single black arrows indicate reactions, double headed arrows indicate diffusion, grey arrows indicate activation and grey blunt arrows indicate inhibition. (a) A minimal QS module. (b) Target expression versus cell density. Each curve represents the action of cell-cell communication as in (a) but with different parameters. K refers to the threshold signal concentration leading to 50% target expression (inset). The effect of parameters is indicated. Vertical stippled lines for each case marks the critical density at which signal concentration exceeds K. Note that increasing k, decreasing D and da lower the critical density (lower dcrit) for target expression. Lowering K (horizontal stippled line) decreases dcrit too. (c) Noise reduction by quorum sensing. Histogram of activated LuxR for unstable (blue) and stable (red) LuxR. Y axis shows the frequency with which corresponding number of activated LuxR molecules on the×axis is observed over time. Each histogram is generated from a time course simulation of the minimal QS system (inset). Parameters are chosen so that the mean number of activated LuxR is the same in either case. Unstable LuxR reduces noise, resulting in a tighter control on the number of activated LuxR molecules than in the case without diffusion. See Tanouchi et al. [34] for details. (d) Kinetic proofreading in QS signal recognition. Sequential reactions involving signal (A) binding to an R-protein (R) and dimerization of R-A complex constitute a mechanism analogous to the canonical Hopfield-Ninio model of kinetic proofreading (gray shade). Stabilization of R by A provides another layer of kinetic proofreading especially when R is unstable (red shade). Signal A could be cognate or non-cognate, the difference lying in the reaction rates of the steps shown. Redrawn from ref. [36].
Fig. 2
Fig. 2. Synthetic systems with communication within a population
(a) A population controller. The circuit uses the schematic in Fig.1a but here the signal-bound LuxR drives expression of a toxin CcdB. Redrawn from ref. [46] (b) Density dependent invasion circuit. The circuit architecture differs slightly from (a) with the invasin gene (inv) expression controlled by communication. Redrawn from ref. [65]
Fig. 3
Fig. 3. Synthetic systems with communication between populations
(a) Pattern formation using signal senders and receivers (top left) with spatial signal gradient around senders (Bottom left). Receivers (top center) are programmed to express fluorescence (green curve) in a narrow range of signal concentrations (bottom center). The positioning of the detection band can be changed (dotted green) by manipulating the receiver circuit elements. Active parts of receiver circuit logic at different AHL concentrations are shown (Top right). In a circular domain with senders in the middle and receivers everywhere on the surface of the circle, a ring like pattern will emerge. Redrawn from ref. [55] (b) Synthetic cooperative system. Cooperators constitutively synthesize the AHL signal C4HSL via RhlI. Non-cooperators do not express RhlI. Both populations constitutively express RhlR which, when signal-bound, induces the expression of a chloramphenicol resistance gene (catLVA). Redrawn from ref. [76] (c) Microbial consensus consortium (MCC). LasI and RhlI catalyze the synthesis of AHLs, 3OC12HSL (red circles) and C4HSL (green circles), which activate LasR and RhlR, respectively. The activated regulators then activate their target reporters, RFP and GFP respectively. Both populations need to be at sufficient density (not equal) for concurrent expression of both reporters. Redrawn from ref. [53] (d) Synthetic predator-prey system. Predator and prey synthesize 3OC12HSL (green circles) and 3OC6HSL (red circles) via LasI and LuxI, respectively. Toxin, CcdB, is produced constitutively in the predator but is under PluxI control in the prey. In the predator, antidote CcdA is under PluxI control. 3OC12HSL-bound LasR does induce expression from PluxI. The predator requires sufficient number of prey cells to sustain enough expression of CcdA to survive. On the other hand, the prey dies due to CcdB expression when the density of predator is high. Redrawn from ref. [80] (e) Another design of synthetic predator-prey system. The system consists of wild-type E. coli cells (predator) and Chinese hamster ovary cells (prey) in a medium containing ampicillin. Rapid growth of the predator limits the prey’s growth by depleting nutrients. Prey constitutively expresses BLA that degrades ampicillin. Redrawn from ref. [82] (e) A synthetic obligatory cooperation circuit with two mutually dependent yeast populations. XLA indicates yeast cell that overproduces lysine but requires external adenine. YAL overproduces adenine but requires external lysine supply. Redrawn from ref. [83]

References

    1. Voigt CA. Genetic parts to program bacteria. Curr Opin Biotechnol. 2006;17:548–557. - PubMed
    1. Lucks JB, Qi L, Whitaker WR, Arkin AP. Toward scalable parts families for predictable design of biological circuits. Curr Opin Microbiol. 2008;11:567–573. - PubMed
    1. Chin JW. Programming and engineering biological networks. Curr Opin Struct Biol. 2006;16:551–556. - PubMed
    1. Haseltine EL, Arnold FH. Synthetic gene circuits: design with directed evolution. Annu Rev Biophys Biomol Struct. 2007;36:1–19. - PubMed
    1. Marguet P, Balagadde F, Tan C, You L. Biology by design: reduction and synthesis of cellular components and behaviour. J R Soc Interface. 2007;4:607–623. - PMC - PubMed

Publication types