Comparative Study
. 2010 Feb;114(2):129-50.
doi: 10.1016/j.cognition.2009.08.008. Epub 2009 Sep 5.

Comparing perception of Stroop stimuli in focused versus divided attention paradigms: evidence for dramatic processing differences

Affiliations
Comparative Study

Comparing perception of Stroop stimuli in focused versus divided attention paradigms: evidence for dramatic processing differences

Ami Eidels et al. Cognition. 2010 Feb.

Abstract

A huge set of focused attention experiments show that when presented with color words printed in color, observers report the ink color faster if the carrier word is the name of the color rather than the name of an alternative color, the Stroop effect. There is also a large number (although not so numerous as the Stroop task) of so-called "redundant targets studies" that are based on divided attention instructions. These almost always indicate that observers report the presence of a visual target ('redness' in the stimulus) faster if there are two replications of the target (the word RED in red ink color) than if only one is present (RED in green or GREEN in red). The present set of four experiments employs the same stimuli and same participants in both designs. Evidence supports the traditional interference account of the Stroop effect, but also supports a non-interference parallel processing account of the word and the color in the divided attention task. Theorists are challenged to find a unifying model that parsimoniously explains both seemingly contradictory results.


Figures

Figure 1
Figure 1
Schemas for strictly parallel (A) and coactive (B) processing. For the parallel channels arrangement, detection is made separately for word and for color. The coactivation arrangement, by contrast, entails integration of information from the two channels in a common decision mechanism.
Figure 2
Figure 2
Different predictions by separate channels (left column) and by interactive channels (right column) models. A: Families of cumulative density functions. B: Survivor function versions for testing the race model inequality (RMI). Violations of the inequality SWC(t) ≥ SW(t) + SC(t) − 1, expressed as negative values, correspond to violations of the race model inequality at that time. C: Survivor function tests of the Grice inequality (GI). Violations of the inequality min[SW(t), SC(t)] ≥ SWC(t), expressed as negative values, correspond to violations of Grice’s inequality at that time. D: Capacity coefficient, C(t), as a function of time.
Figure 3
Figure 3
Three possible outcomes of factorial experiments. The two variables are target type (color, word) and target salience (high, low).
Figure 4
Figure 4
Mean factorial plots (A) and SIC(t) functions (B). The predictions agree on A, but differ for B.
Figure 5
Figure 5
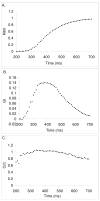
Results of Experiment 1. A: Survivor function test of the race model inequality (RMI). Violations of the inequality SWC(t) ≥ SW(t) + SC(t) − 1, expressed as negative values, correspond to violations of the race model inequality at that time. B: Survivor function test of Grice’s inequality (GI). Violations of the inequality min[SW(t), SC(t)] ≥ SWC(t), expressed as negative values, correspond to violations of Grice’s inequality at that time. C: Capacity coefficients, C(t), for Experiment 1.
Figure 6
Figure 6
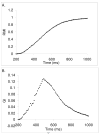
Results of Experiment 2. A: Survivor function test of the race model inequality. B: Survivor function test of Grice’s inequality.
Figure 7
Figure 7
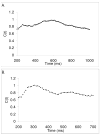
Capacity coefficient, C(t), for data pooled over participants (A) and for an individual observer, participant 2 (B).
Figure 8
Figure 8
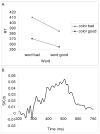
Results from trials with redundant targets. A: Factorial plot of target (color, word) by salience (bad, good). B: Survivor interaction contrast, SIC(t), for the same data.
Figure 9
Figure 9
Factorial plot for the subset of redundant-targets trials (A) and the associated survivor interaction contrast function (B) for Participant 3. Panels C and D provide the same results for Participant 5.
Figure 10
Figure 10
Capacity coefficient (A) and race model inequality (B) for Participant 5.
Figure 11
Figure 11
Results of Experiment 2 for the subset of target-absent trials. Shown are the mean interaction contrast (A) and the associated survivor interaction contrast (B).
Figure 12
Figure 12
Results of Experiment 3. A: Survivor function test of the race model inequality. B: Survivor function test of Grice’s inequality. C: Capacity coefficient, C(t).
Figure 13
Figure 13
Results of Experiment 3 considering only redundant targets trials. A: Factorial plot of target (color, word) × salience (high, low). B: Survivor interaction contrast, SIC(t), for the same data.
Figure 14
Figure 14
Results of Experiment 3 for the subset of target-absent trials. Shown are the mean interaction contrast (A) and the associated survivor interaction contrast (B).
Figure 15
Figure 15
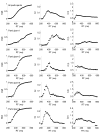
Results of Experiment 4 in the target detection task, for the condition with RED and red as targets. The left column depicts the results with respect to the race model inequality (RMI). The middle column depicts the results with respect to the Grice inequality (GI). The right column presents the capacity coefficient, C(t). Top: all observers; Rows 2–5: data for individual observers 1, 3, 6, and 9, respectively.
Figure 16
Figure 16
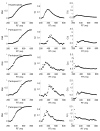
Results of Experiment 4 in the target detection task, for the condition with RED and green as targets. The left column depicts the results with respect to the race model inequality (RMI). The middle column depicts the results with respect to the Grice inequality (GI). The right column presents the capacity coefficient, C(t). Top: all observers; Rows 2–5: data for indivual observers 15, 16, 17, and 19, respectively.

References

    1. Algom D, Chajut E, Lev S. A rational look at the emotional Stroop phenomenon: A generic slowdown, not a Stroop effect. Journal of Experimental Psychology: General. 2004;133:323–338. - PubMed
    1. Algom D, Dekel A, Pansky A. The perception of number from the separability of the stimulus: The Stroop effect revisited. Memory & Cognition. 1996;24:557–572. - PubMed
    1. Ashby FG, Townsend JT. Varieties of perceptual independence. Psychological Review. 1986;93:154–179. - PubMed
    1. Bauer B, Besner D. Processing in the Stroop task: Mental set as a determinant of performance. Canadian Journal of Experimental Psychology. 1997;51:61–68.
    1. Besner D. The myth of ballistic processing: Evidence from the Stroop paradigm. Psychonomic Bulletin & Review. 2001;8:324–330. - PubMed

Publication types

LinkOut - more resources