. 2010 Jan;192(1):46-58.
doi: 10.1128/JB.00872-09.

Small stress response proteins in Escherichia coli: proteins missed by classical proteomic studies

Affiliations

Small stress response proteins in Escherichia coli: proteins missed by classical proteomic studies

Matthew R Hemm et al. J Bacteriol. 2010 Jan.

Abstract

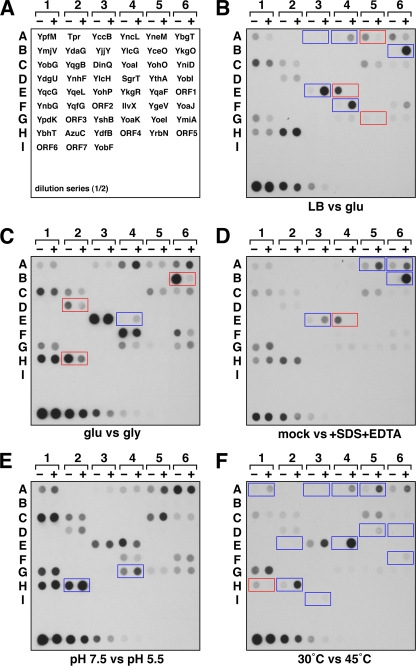
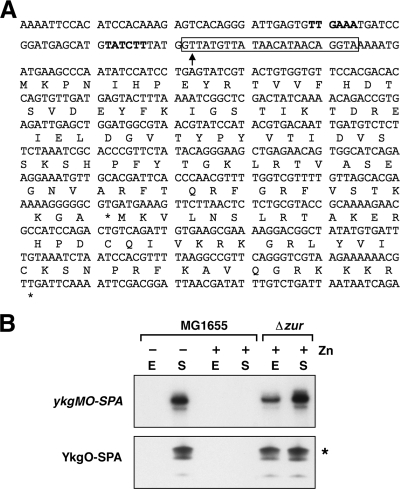
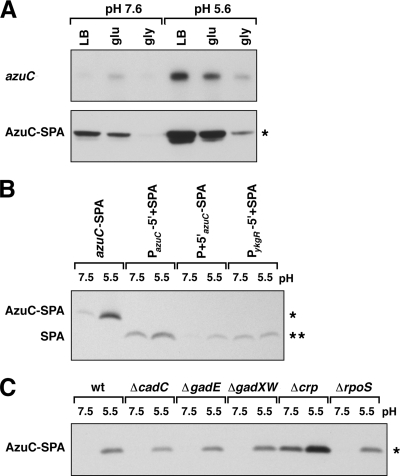
Proteins of 50 or fewer amino acids are poorly characterized in all organisms. The corresponding genes are challenging to reliably annotate, and it is difficult to purify and characterize the small protein products. Due to these technical limitations, little is known about the abundance of small proteins, not to mention their biological functions. To begin to characterize these small proteins in Escherichia coli, we assayed their accumulation under a variety of growth conditions and after exposure to stress. We found that many small proteins accumulate under specific growth conditions or are stress induced. For some genes, the observed changes in protein levels were consistent with known transcriptional regulation, such as ArcA activation of the operons encoding yccB and ybgT. However, we also identified novel regulation, such as Zur repression of ykgMO, cyclic AMP response protein (CRP) repression of azuC, and CRP activation of ykgR. The levels of 11 small proteins increase after heat shock, and induction of at least 1 of these, YobF, occurs at a posttranscriptional level. These results show that small proteins are an overlooked subset of stress response proteins in E. coli and provide information that will be valuable for determining the functions of these proteins.


Figures

FIG. 1.
FIG. 1.
Dot blot analysis of small protein levels under different growth conditions. (A) Diagram of spotting patterns. Each tagged protein was assayed under two conditions, designated + or −. A twofold dilution series for YbgT-SPA from cells grown in LB is at the bottom of each blot, with a final dilution of 1:2,048. Predicted, unannotated ORFs for which we had not previously seen full-length protein expression are designated ORF1 to ORF7: ORF1, ymjC′-ycjY; ORF2, ycgI′-minE; ORF3, ykgD-ykgE; ORF4, gmr-rnb; ORF5, ydjA-sppA; ORF6, fabG-acpP; ORF7, pyrG-mazG (see Table S3 in the supplemental material). (B) Dot blot of protein levels in LB (−) versus minimal glucose medium (+). (C) Dot blot of protein levels in minimal glucose (−) versus minimal glycerol medium (+). (D) Dot blot of protein levels in LB (−) or LB plus 0.025% SDS and 1 mM EDTA (+). (E) Dot blot of protein levels in LB-MOPS (pH 7.5) (−) or LB-MES (pH 5.5) (+). (F) Dot blot of protein levels in LB at 30°C (−) or after transfer to 45°C (+). A longer exposure of this dot blot (presented in Fig. S2 of the supplemental material) shows the changes in the less abundant small proteins after heat shock. In all cases, strains were grown as 5-ml cultures in 50-ml Falcon tubes. With the exception of the cultures exposed to heat shock, all cells were grown at 37°C. Cells were collected and samples were analyzed by dot blotting as described in Materials and Methods. Proteins whose expression was induced under the + condition are boxed in blue, while proteins whose expression was reduced under the + condition are boxed in red.
FIG. 2.
FIG. 2.
Western blot analysis of small protein levels. (A) Proteins induced by SDS and/or EDTA exposure. Cells grown overnight in LB were diluted into 30 ml of LB and grown to an OD600 of 0.2 to 0.3. Cultures were then split into five 5-ml aliquots and exposed to water, 0.025% SDS, 1 mM EDTA, or 0.025% SDS plus 1 mM EDTA. Cells were harvested before stress (T0) and at an OD600 of 1.2 to 1.7. (B) Proteins induced under acidic conditions. Cells grown overnight in LB were diluted into 30 ml of either LB-MOPS (pH 7.5) or LB-MES (pH 5.5) and harvested at an OD600 of 0.3 to 0.4. (C) Proteins induced by heat shock. Cells grown overnight in LB at 30°C were diluted into 30 ml of LB and grown at 30°C to an OD600 of 0.4. Cultures were then split into three 10-ml aliquots. One set of samples was transferred to 45°C, while the other half was kept at 30°C. Cells were harvested before transfer (T0) as well as 5 and 20 min after transfer. Western blot analysis using anti-FLAG, alkaline phosphatase-conjugated antibodies was carried out with whole-cell extracts harvested from the cultures above. Asterisks denote the band corresponding to the fusion protein. Exposure times were optimized for each panel for visualization here; therefore, the signal intensity shown does not indicate relative abundance between proteins.
FIG. 3.
FIG. 3.
Zur repression of ykgO. (A) Sequence of the ykgM-ykgO promoter and coding region. The +1 site of transcription (24) is denoted with an arrow. Potential σ70 −10 and −35 sequences are indicated in bold, and the predicted Zur binding site is boxed. (B) ykgO-SPA mRNA (top) and YkgO-SPA protein (bottom) levels in MG1655 and Δzur cells grown in minimal glucose medium with (+) or without (−) zinc. Overnight cultures were grown in M63 containing 0.2% glucose and 100 μM zinc acetate. Cells were washed twice in M63 containing 0.2% glucose and diluted into M63 glucose medium lacking or containing 100 μM zinc acetate. Cells were harvested at exponential (E) and stationary (S) phase and tested for ykgO-SPA expression and YkgO-SPA synthesis. For the Northern analysis, total RNA (5 μg of each sample) was separated on a 6% acrylamide gel. RNA was transferred to nitrocellulose and probed with an end-labeled oligonucleotide complementary to the ykgO ORF. The band runs at ∼600 nucleotides, consistent with the expected size of the ykgM-ykgO-SPA transcript. Western blot analysis was performed as stated for Fig. 2. The asterisk denotes a band corresponding to the full-length SPA-tagged YkgO protein.
FIG. 4.
FIG. 4.
CRP repression of azuC. (A) Sequence of the azuC promoter and coding region. The +1 site of transcription (position 1986025 of the E. coli K-12 genome) is denoted with an arrow. Potential σ70 −10 and −35 sequences are indicated in bold, and the predicted CRP binding sites are boxed. (B) azuC-SPA mRNA (top) and AzuC-SPA protein (bottom) levels in MG1655 and Δcrp cells grown in minimal glucose (glu) and minimal glycerol (gly) media supplemented with 0.2% Casamino Acids and 0.0005% vitamin B1. M63 glucose and M63 glycerol cultures (30 ml inoculated with overnight cultures grown in the respective medium) were grown at 37°C to an OD600 of 0.3 to 0.4. Northern analysis was performed as described for Fig. 3. The RNA band runs at ∼400 nucleotides, consistent with the expected size of the azuC-SPA transcript. Western blot analysis was performed as stated for Fig. 2. The asterisk denotes a band corresponding to the full-length SPA-tagged AzuC protein.
FIG. 5.
FIG. 5.
Acid induction of azuC. (A) azuC mRNA (top) and AzuC-SPA protein (bottom) levels in MG1655 in LB, minimal glucose (glu), and minimal glycerol (gly) medium buffered at pH 7.6 or 5.6. The RNA band runs at ∼400 nucleotides, consistent with the expected size of the azuC-SPA transcript. Cells were diluted into the respective medium from overnight cultures grown in LB. (B) Acid induction of azuC transcriptional and translational fusions. Extracts from strains containing the SPA-tagged azuC allele (azuC-SPA), a transcriptional fusion to the azuC promoter (PazuC-5′+SPA), a translational fusion to the azuC promoter and 5′ UTR (P + 5′azuC-SPA), or a control transcriptional fusion to the ykgR promoter (PykgR-5′+SPA) were probed for SPA expression in LB-MOPS (pH 7.5) and LB-MES (pH 5.5). In the transcriptional fusions, the azuC and ykgR 5′-UTRs were replaced by the MCS 5′-UTR from pBAD24, and the ORFs were replaced by the SPA tag. In the translational fusion, the azuC ORF was replaced just by the SPA tag (see Materials and Methods). Cultures grown overnight in LB were diluted into 10 ml of LB-MOPS (pH 7.6) or LB-MES (pH 5.6), and cells were harvested at an OD600 of 0.45 to 0.6. (C) AzuC-SPA expression in wild-type and mutant cells grown in neutral and acidic media. Cultures grown overnight in LB were diluted into 5 ml LB-MOPS (pH 7.6) or LB-MES (pH 5.6), and cells were harvested at an OD600 of 0.45 to 0.6. Northern analysis was performed as described for Fig. 3. Western blot analysis was performed as stated for Fig. 2. A single asterisk denotes a band corresponding to the full-length SPA-tagged AzuC protein, and a double asterisk denotes a band corresponding to the SPA peptide.
FIG. 6.
FIG. 6.
CRP activation of ykgR. (A) Sequence of the ykgR promoter and coding region. The +1 site of transcription (position 312510 of the E. coli K-12 genome) is denoted with an arrow. A potential σ70 −10 sequence is indicated in bold, and the predicted CRP binding site is boxed. (B) Primer extension analysis of ykgR-SPA mRNA (top) and Western blot analysis of YkgR-SPA protein (bottom) levels in MG1655 and Δcrp cells grown in minimal glucose (glu) and minimal glycerol (gly) medium supplemented with 0.2% Casamino Acids and 0.0005% vitamin B1. M63 glucose and M63 glycerol cultures (inoculated from overnight cultures grown in the respective medium) were grown at 37°C to an OD600 of 0.3 to 0.4. Primer extension assays were conducted using 5 μg total RNA of each sample and an end-labeled oligonucleotide complementary to the ykgR ORF. Western blot analysis was performed as stated for Fig. 2. The asterisk denotes a band corresponding to the full-length SPA-tagged YkgR protein.
FIG. 7.
FIG. 7.
Heat shock induction of ykgR. (A) Primer extension analysis of ykgR-SPA mRNA (top) and Western blot analysis of YkgR-SPA protein (bottom) levels in MG1655 without and with heat shock. Thirty-milliliter LB, M63 glucose, or M63 glycerol cultures were inoculated with a dilution of overnight LB cultures and grown to an OD600 of 0.3 to 0.4 before being split into three 10-ml aliquots. Two aliquots were kept at 30°C while the other was incubated at 45°C. Cells were harvested before transfer (T0) and after 20 min (30°C or 45°C). (B) Heat shock induction of ykgR transcriptional and translational fusions. Extracts from strains containing the SPA-tagged ykgR allele (ykgR-SPA), a transcriptional fusion to the ykgR promoter (PykgR-5′+SPA), a translational fusion to the ykgR promoter and 5′-UTR (P + 5′ykgR-SPA), or a control transcriptional fusion to the azuC promoter (PazuC-5′+SPA) were probed for SPA expression in cells without or with heat shock. In the transcriptional fusions, the ykgR and azuC 5′-UTRs were replaced by the MCS 5′-UTR from pBAD24, and the ORFs were replaced by the SPA tag. In the translational fusion, the ykgR ORF was replaced by the SPA tag. Cultures grown overnight in LB were diluted into 30 ml LB and grown to an OD600 of 0.4 to 0.5 before being split into two 10-ml aliquots. One aliquot was kept at 30°C while the other was incubated at 45°C. (C) YkgR-SPA expression in wild-type cells and cells with altered sigma factor levels. YkgR-SPA levels were assayed in wild-type and ΔrpoS cells without and with heat shock, as well as in ykgR-SPA cells in which σH or σE synthesis was induced by the addition of isopropyl-β-d-thiogalactopyranoside (IPTG) to half of the sample. MG1655 and ΔrpoS cells grown overnight in LB were diluted into 30 ml LB and incubated at 30°C until the OD600 reached 0.4. Cultures were then split into two 10-ml aliquots. One set of samples was transferred to 45°C while the other was kept at 30°C. Cells were harvested before transfer (T0) and after 20 min of induction (30°C and 45°C). YkgR-SPA cells containing rpoH (pSAKTtrc) and rpoE (pCL245) overexpression plasmids were grown overnight in LB plus 100 μg/ml carbenicillin and were diluted into 30 ml of LB plus 100 μg/ml carbenicillin. At an OD600 of 0.4, cultures were split into two 10-ml aliquots, and sigma factor expression was induced in one set of samples by adding IPTG to 1 mM. Cells were harvested before induction (T0) and 20 min after induction (− and +, respectively). Primer extension assays were as conducted as described for Fig. 6. Western blot analysis was performed as stated for Fig. 2. A single asterisk denotes a band corresponding to the full-length SPA-tagged YkgR protein, and a double asterisk denotes a band corresponding to the SPA peptide.
FIG. 8.
FIG. 8.
Posttranscriptional heat shock induction of YobF. (A) Sequence of the yobF-cspC promoter and coding region. The +1 site of both the longer transcript (position 1905817 of the E. coli K-12 genome) and the shorter transcript (position 1996212 of the E. coli K-12 genome) are denoted by arrows. Possible σ70 binding sites are indicated in bold, and nucleotides that are predicted to base pair with the OxyS small RNA are denoted with dots. (B) yobF-cspC mRNA (top) and YobF-SPA protein (bottom) levels in cells exposed to heat shock. Samples were treated as for Fig. 7A. Cells were harvested before transfer (T0) and after 20 min at 30°C or 45°C. (C) YobF-SPA levels in a Δlon mutant strain. Again, cells were harvested from samples kept at 30°C or 45°C for 20 min or before transfer (T0). (D) YobF heat shock induction with and without hydrogen peroxide exposure in MG1655 and an ΔoxyS mutant. Heat shock induction was conducted as described for panel C, except that in some cases, hydrogen peroxide was added to the cells to a final concentration of 250 μM, 10 min prior to heat shock. Northern analysis was performed as described for Fig. 3. The prominent smaller RNA band runs at ∼600 nucleotides, consistent with the expected size of the shorter yobF-SPA transcript. Western blot analysis was performed as stated for Fig. 2. The asterisk denotes a band corresponding to the full-length SPA-tagged YobF protein.

Comment in

References

    1. Ades, S. E. 2008. Regulation by destruction: design of the σE envelope stress response. Curr. Opin. Microbiol. 11:535-540. - PubMed
    1. Alix, E., and A. B. Blanc-Potard. 2008. Peptide-assisted degradation of the Salmonella MgtC virulence factor. EMBO J. 27:546-557. - PMC - PubMed
    1. Brøndsted, L., and T. Atlung. 1996. Effect of growth conditions on expression of the acid phosphatase (cyx-appA) operon and the appY gene, which encodes a transcriptional activator of Escherichia coli. J. Bacteriol. 178:1556-1564. - PMC - PubMed
    1. Burkholder, W. F., I. Kurtser, and A. D. Grossman. 2001. Replication initiation proteins regulate a developmental checkpoint in Bacillus subtilis. Cell 104:269-279. - PubMed
    1. Castanie-Cornet, M. P., and J. W. Foster. 2001. Escherichia coli acid resistance: cAMP receptor protein and a 20 bp cis-acting sequence control pH and stationary phase expression of the gadA and gadBC glutamate decarboxylase genes. Microbiology 147:709-715. - PubMed

Publication types

MeSH terms

LinkOut - more resources