. 2009 Oct;12(10):1285-92.
doi: 10.1038/nn.2394. Epub 2009 Sep 6.

Neuron-glia communication via EphA4/ephrin-A3 modulates LTP through glial glutamate transport

Affiliations

Neuron-glia communication via EphA4/ephrin-A3 modulates LTP through glial glutamate transport

Alessandro Filosa et al. Nat Neurosci. 2009 Oct.

Abstract

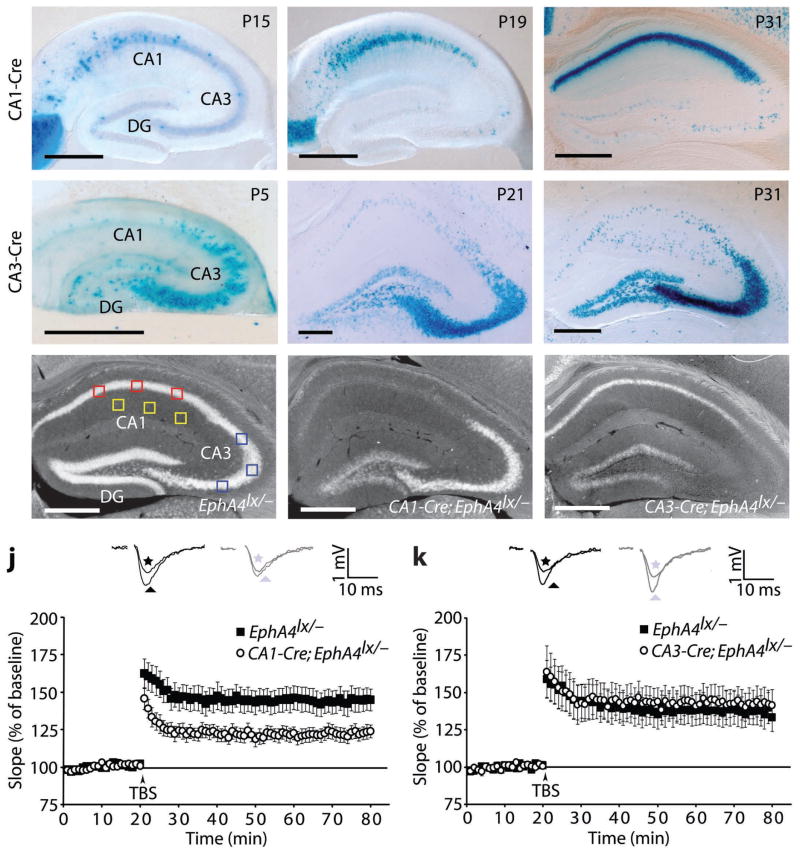
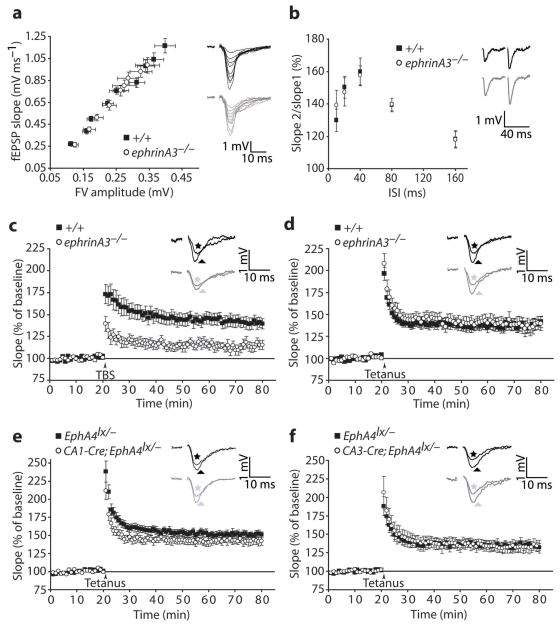
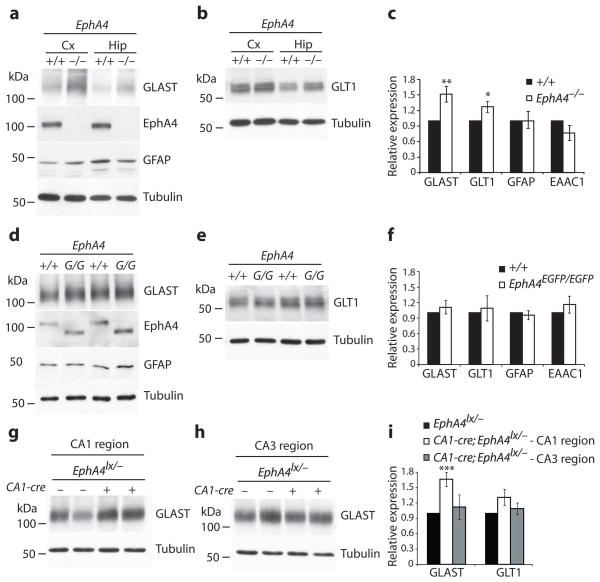
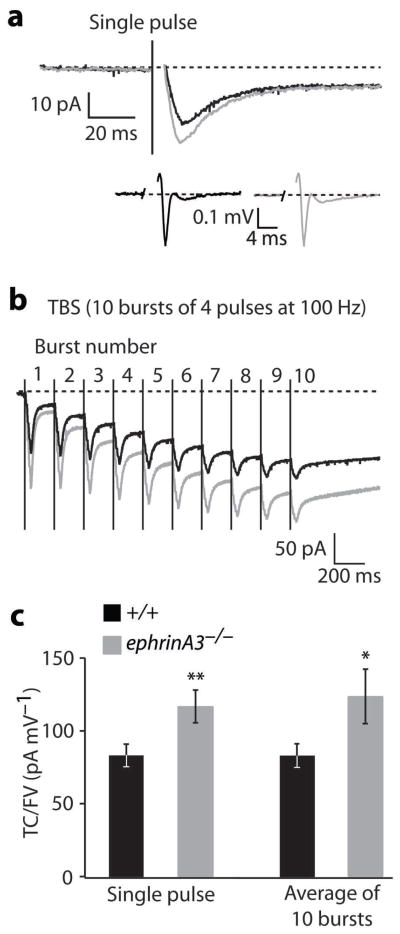
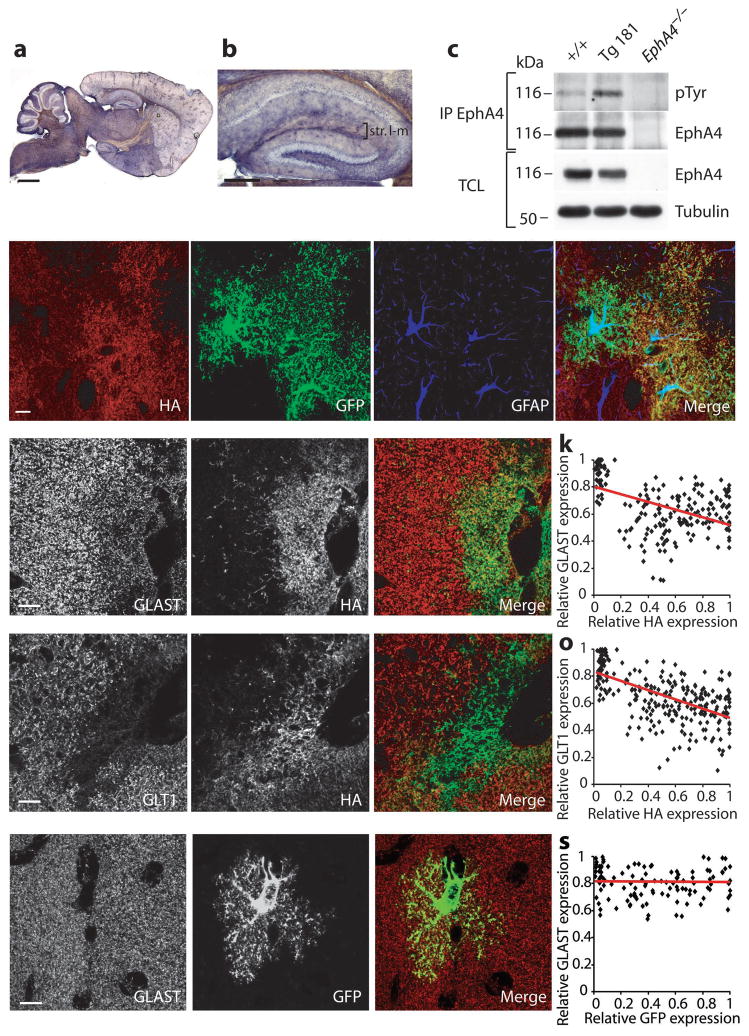
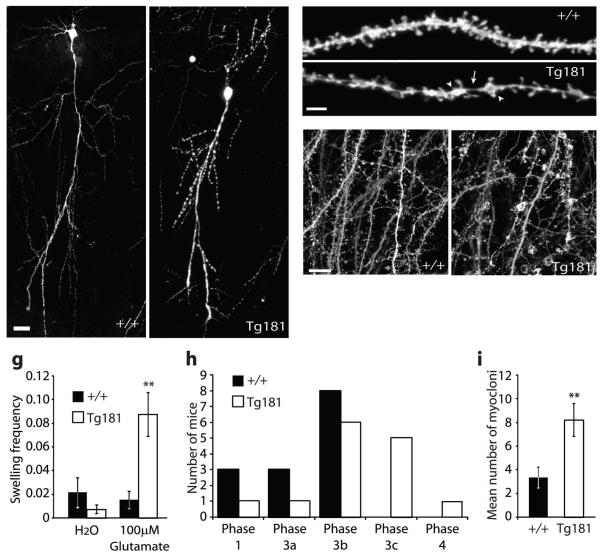
Astrocytes are critical participants in synapse development and function, but their role in synaptic plasticity is unclear. Eph receptors and their ephrin ligands have been suggested to regulate neuron-glia interactions, and EphA4-mediated ephrin reverse signaling is required for synaptic plasticity in the hippocampus. Here we show that long-term potentiation (LTP) at the CA3-CA1 synapse is modulated by EphA4 in the postsynaptic CA1 cell and by ephrin-A3, a ligand of EphA4 that is found in astrocytes. Lack of EphA4 increased the abundance of glial glutamate transporters, and ephrin-A3 modulated transporter currents in astrocytes. Pharmacological inhibition of glial glutamate transporters rescued the LTP defects in EphA4 (Epha4) and ephrin-A3 (Efna3) mutant mice. Transgenic overexpression of ephrin-A3 in astrocytes reduces glutamate transporter levels and produces focal dendritic swellings possibly caused by glutamate excitotoxicity. These results suggest that EphA4/ephrin-A3 signaling is a critical mechanism for astrocytes to regulate synaptic function and plasticity.


Figures

Fig. 1
Fig. 1
EphA4 is required for LTP in post-synaptic CA1 cells. a–f, Xgal staining of hippocampal sections of the indicated postnatal (P) ages (days) of CA1-Cre;Rosa26lx/+ (a–c) and CA3-Cre;Rosa26lx/+ (d–f) mice. CA1, cornu ammonis 1; CA3, cornu ammonis 3; DG, dentate gyrus. g–i, In situ hybridizations for EphA4 mRNA in adult hippocampus from mice of the indicated genotypes. The small squares indicate the regions used for densitometric measurements for the calculation of the recombination efficiency. Red squares, CA1; blue squares, CA3; yellow squares, background. Scale bars: 500 μm. Recombination efficiencies of CA1-Cre and CA3-Cre in CA1 and CA3, respectively was approximately 80% (see text) and of CA3-Cre in dentate gyrus was 36% (data not shown). j,k, Scatter plots showing LTP, represented as a percentage of the baseline, induced by stimulation of presynaptic CA3 neurons with three TBS. Insets: representative traces from controls (black) and mutants (gray) recorded before (stars) and 55–60 min after (triangles) LTP induction. For reasons of clarity the stimulation artifact was removed. j, CA1-Cre;EphA4lx/− mice show a marked deficit in early CA3-CA1 LTP compared to littermate EphA4lx/− controls (123.0 ± 4.4% in mutants, n=12 slices, 7 mice versus 144.8 ± 7.6% in controls, n=14 slices, 7 mice, at 55–60 min after stimulus, t-test, p=0.02). k, CA3-Cre;EphA4lx/− mice show normal TBS-induced LTP (142.9 ± 10.0% in mutants, n=10 slices, 8 mice, versus 136.9 ± 9.7% in controls, n=10 slices, 8 mice, at 55–60 min after stimulus, t-test, p=0.7). Error bars: s.e.m.
Fig. 2
Fig. 2
EphrinA3 is required for TBS-induced LTP. a, fEPSPs slopes at various stimulus intensities (FV, fiber volley) and representative traces (+/+, black; ephrinA3, gray, n=12 slices, 6 mice per group, ANCOVA, p=0.1). b, PPF at various ISIs and representative traces at 40 ms ISI (+/+, black; ephrinA3, gray, n=10 slices, 5 mice per group, two-way repeated measures ANOVA, between genotypes: F(1, 90)=0.03, p=0.9). c–f, Scatter plots showing LTP induced by stimulation of presynaptic CA3 neurons with three TBS (c) or a single tetanus (d–f). c, ephrinA3−/− mice show a strong deficit in TBS-induced LTP compared to +/+ controls (+/+, 140.7 ± 6.1%, n=14 slices, 10 mice; ephrinA3−/−, 114.8 ± 5.0% n=12 slices, 10 mice, at 55–60 min after stimulus, t-test, p=0.004). d, ephrinA3−/− mice show normal tetanus-induced LTP (+/+, 138.6 ± 6.0%, n=13 slices, 10 mice; ephrinA3−/−, 137.9 ± 7.7% n=12 slices, 10 mice, at 55–60 min after stimulus, t-test, p=0.9). e, CA1-Cre;EphA4lx/− mice show normal tetanus-induced LTP (142.8 ± 6.0% in mutants, n=11 slices, 9 mice, versus 151.0 ± 11.0% in controls, n=12 slices, 9 mice, at 55–60 min after stimulus, t-test, p=0.5). f, CA3-Cre;EphA4lx/− mice have normal tetanus-induced LTP (133.8 ± 7.9% in mutants, n=10 slices, 8 mice, versus 134.0 ± 5.4% in controls, n=9 slices, 8 mice, at 55–60 min after stimulus, t-test, p=1.0). Insets: representative traces from controls (black) and mutants (gray) recorded before (stars) and 55–60 min after (triangles) LTP induction. The stimulation artifacts were removed. Error bars: s.e.m.
Fig. 3
Fig. 3
Upregulation of GLAST and GLT-1 protein levels in EphA4 mutants. a,b, Protein lysates from cerebral cortex (Cx) and hippocampus (Hip) derived from EphA4−/− and littermate +/+ controls were compared by western blot analysis for their content of GLAST, GLT-1, GFAP, EAAC1, EphA4 and Tubulin. c, Quantification of glutamate transporter levels and GFAP in hippocampi of EphA4−/− and littermate +/+ controls. Expression levels were normalized to Tubulin levels by densitometric measurements. Mean values of intensities of the indicated proteins are shown relative to levels in +/+ protein lysates. GLAST and GLT1 levels were increased by 50% and 25% respectively in EphA4−/− mice (GLAST **p=0.009, n=10 mice per group; GLT1 *p=0.03, n=15 mice, GFAP p=0.2, n=10 mice; EAAC1 p=0.3, n=3 mice, t-test) compared to +/+ controls. d,e, Western blot analysis of hippocampal protein lysates from EphA4EGFP/EGFP (G/G) and littermate +/+ controls for their content of GLAST, GLT-1, GFAP, EphA4 and Tubulin. f, Quantification of protein levels calculated as in (c) (n=7–9 mice per group, p>0.3, t-test). g,h, Western blot analysis of protein lysates from dissected CA1 and CA3 regions derived from CA1-Cre;EphA4lx/− mice or EphA4lx/− controls for their content of GLAST and Tubulin. i, GLAST levels in CA1, but not CA3 were increased to the same extend as in EphA4−/− (GLAST in CA1, n=7 mice, ***p=0.0009; GLAST in CA3, n=6 mice, p=0.7; GLT1 in CA1, n=13 mice, p=0.07; GLT1 in CA, n=6 mice, p=0.5; and GFAP, n=6 mice, p=0.9, t-test). Error bars: s.e.m.
Fig. 4
Fig. 4
Astrocytic glutamate transporter currents. a, Mean inward currents in response to a single pulse stimulation of Schaffer collaterals in +/+ (black) and ephrinA3−/− mice (gray). The slow, persistent component did not differ between +/+ and ephrinA3−/− animals. Inset shows mean fiber volleys in +/+ (black) and ephrinA3/ (gray) animals (the peaks of individual traces were aligned in time, before calculating the average). b, Mean inward currents in response to TBS in +/+ animals (black) and ephrinA3−/− animals (gray). Traces are averages from all performed stimulations. The stimulation artifacts in a and b were replaced by a vertical line indicating the start of the stimulation. c, Bar chart illustrating mean glutamate transporter currents amplitudes (TC), normalized to the amplitude of the corresponding fiber volleys (FV). Each transporter current amplitude was divided by the amplitude of the corresponding FV in order to normalize for the numbers of fibers activated. Transporter currents in ephrinA3−/− animals were significantly higher than in +/+ controls in response to a single pulse stimulation (117.7 ± 11.1 pA mV−1 in mutants, n=42 recordings, 20 cells, versus 95.7 ± 8.9 pA mV−1 in +/+ controls, 34 recordings, 17 cells, **p=0.01, t-test) and in response to TBS (124.8 ± 18.8 pA mV−1 in mutants, n=20 measurements, 15 cells, and 83.5 ± 8.5 pA mV−1 in +/+ controls, n=18 measurements, 10 cells; *p=0.03, t-test). Error bars: s.e.m.
Fig. 5
Fig. 5
Glutamate levels, post-synaptic responses to high frequency stimulation and pharmacological rescue of LTP. a, Representative traces of mEPSCs in +/+ and EphA4−/− mice in absence and presence of 1 mM γ-DGG. b, Histogram illustrating the inhibitory effect of γ-DGG on mean mEPSCs amplitude in EphA4−/− mice and controls. Inhibition was stronger in EphA4−/− slices than in +/+ controls (18.6%±2.4% versus 11.6%±2.3%, *p=0.04, t-test; n=13 mice per group). c–e, Histograms depicting the fEPSP slope4/slope1 ratio during a train of four stimuli at 100Hz (0.67±0.07 in CA1-Cre;EphA4lx/−, n=12 slices, 7 mice. 1.07±0.16 in EphA4lx/−, n=14 slices, 7 mice, p=0.03; 1.06±0.09 in ephrinA3−/−, n=14 slices, 9 mice, 1.51±0.2 in +/+, n=13 slices, 9 mice, p=0.05; 0.98±0.14 in CA3-Cre;EphA4lx/−, n=9 slices, 6 mice, 1.12±0.13 in EphA4lx/−, n=10 slices, 6 mice, p=0.5, t-test). Insets: traces from one representative train in controls (black) and mutants (gray). The stimulation artifacts were removed. f,g, Graphs showing TBS-induced LTP in presence of TFB-TBOA (applied 8 min before TBS and washed-out 2 min after) in CA1-Cre;EphA4lx/− (f) and ephrinA3−/− (g) mice. (153.5±9.1% in CA1-Cre;EphA4lx/−, n=9 slices, 7 mice, 145.2±6.7% in EphA4lx/−, n=10 slices, 7 mice, p=0.6; 152.6 ± 7.6% in ephrinA3−/−, n=11 slices, 9 mice, 149.9±10.1% in +/+, n=10 slices, 9 mice, p=0.8, t-test). Insets: representative traces from controls (black) and mutants (gray) recorded before (stars) and 55–60 min after (triangles) LTP induction. The stimulation artifacts were removed. Error bars: s.e.m.
Fig. 6
Fig. 6
EphrinA3 overexpression in astrocytes reduces glutamate transporters. a,b Anti-HA immunohistochemistry from Tg181 showing scattered distribution of transgenic protein throughout the brain and hippocampus. c, Transgenic ephrinA3 induces higher endogenous phosphorylation of EphA4. EphA4 was immunoprecipitated (IP) from +/+ and Tg181 hippocampal lysates, and blotted with pTyr and EphA4 antibodies. EphA4/ hippocampal lysates were used as control. Total cell lysates (TCL) of the same fractions show EphA4 and Tubulin levels. d–g, Specific expression of transgenic ephrinA3 in glial cells. Immunofluorescence confocal images of hippocampal sections from adult Tg181 crossed to a GFAP-GFP line . Triple labeling for the indicated proteins show colocalization of HA with GFP but not with the cytoplasmic marker GFAP (g) indicating that the transgenic protein is expressed in fine processes of astrocytes. h–j, l–n, Immunofluorescence single plane confocal images showing double labeling for GLAST/HA (h–j) and GLT1/HA (l–n) in the stratum lacunosum-moleculare from Tg181. k,o, Scatter plots showing the negative correlation between GLAST/HA (k) and GLT1/HA relative pixel intensities (o) (GLAST/HA correlation factor=−0.46, n=198 regions, 3 mice; GLT1/HA correlation factor=−0.58, n=280 regions, 3 mice, t-test, p<0.0001). Linear regression lines are represented in red. p–r, Immunofluorescence single plane confocal images showing double-labeling for GLAST/GFP in GFAP-GFP mice. Expression of GLAST (red) is not affected in locations where the levels of transgenic GFP (green) are high. s, Scatter plot showing no correlation between GLAST/GFP relative pixel intensities (correlation factor=−0.02, n=121 regions, 2 mice, t-test, p>0.1). Scale bars: c, 1 mm; d, 300 μm; e–n, 10 μm.
Fig. 7
Fig. 7
EphrinA3 overexpression in astrocytes increases susceptibility to excitotoxicity and seizures. a,b, Transgenic ephrinA3 causes dendritic beading. Confocal images of single CA1 pyramidal neurons from +/+ (a) and Tg181 (b) mice crossed to GFP-M mice . c,d, Confocal stack of stretches of dendrite of CA1 neurons from +/+ (c) and Tg181(d) mice labeled with DiI; arrowheads point to focal swellings, arrow points to the thin dendritic stretch separating the swellings. e,f, Confocal stacks of CA1 pyramidal dendrites in organotypic slices from +/+ (e) and Tg181 (f) mice crossed to GFP-M mice treated with 100 μM glutamate. g, Bar graph showing the swelling frequency (expressed as number of swellings/dendrite complexity index) in control (H2O) and treated slices. In Tg181 mice there is 5.7-fold increase in swelling frequency compared to +/+ controls (0.088 ± 0.018, n=6 slices, 3 mice, in Tg181 versus 0.015 ± 0.007, n=7 slices, 3 mice, in littermate control +/+ animals, t-test, **p=0.002). h, PTZ-induced epileptic seizures, depicted as maximal phase reached after intra peritoneal injection of 45 mg/kg PTZ, were more severe in Tg 181 mice than in +/+ mice (n=14 mice, p=0.01, Mann–Whitney U-test). Phase classification was performed as described 44. i, Mean number of whole-body myocloni in phase 3 after injection of 45 mg/kg PTZ (3.42 ± 0.82 in +/+ mice, n=12 mice versus 8.25 ± 1.39 in Tg181 mice, n=12, t-test, **p=0.009). Scale bars: a,b, 50 μm; c,d, 5 μm; g, h, 10 μm. Error bars: s.e.m.

References

    1. Allen NJ, Barres BA. Signaling between glia and neurons: focus on synaptic plasticity. Current opinion in neurobiology. 2005;15:542–548. - PubMed
    1. Barres BA. The mystery and magic of glia: a perspective on their roles in health and disease. Neuron. 2008;60:430–440. - PubMed
    1. Halassa MM, Fellin T, Haydon PG. The tripartite synapse: roles for gliotransmission in health and disease. Trends in molecular medicine. 2007;13:54–63. - PubMed
    1. Bergles DE, Jahr CE. Glial contribution to glutamate uptake at Schaffer collateral-commissural synapses in the hippocampus. J Neurosci. 1998;18:7709–7716. - PMC - PubMed
    1. Tzingounis AV, Wadiche JI. Glutamate transporters: confining runaway excitation by shaping synaptic transmission. Nature reviews. 2007;8:935–947. - PubMed

Publication types

MeSH terms

Substances