. 2009 Oct;10(10):1125-32.
doi: 10.1038/ni.1783. Epub 2009 Sep 6.

Thymic self-reactivity selects natural interleukin 17-producing T cells that can regulate peripheral inflammation

Affiliations

Thymic self-reactivity selects natural interleukin 17-producing T cells that can regulate peripheral inflammation

Benjamin R Marks et al. Nat Immunol. 2009 Oct.

Erratum in

  • Nat Immunol. 2010 Jan;11(1):97

Abstract

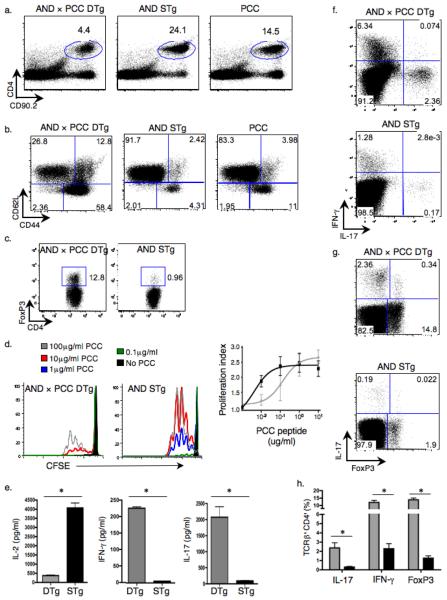
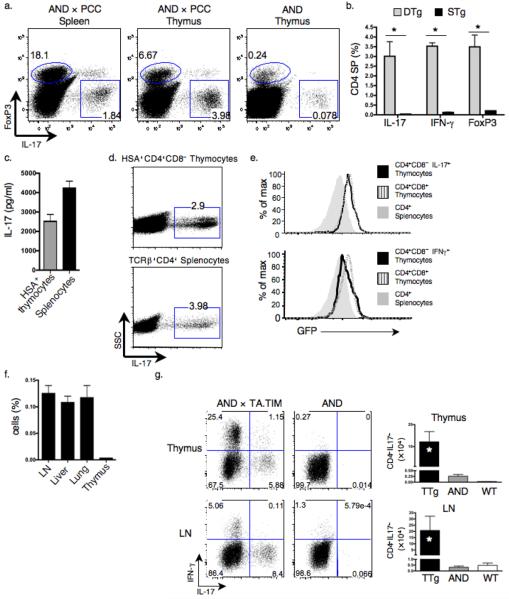
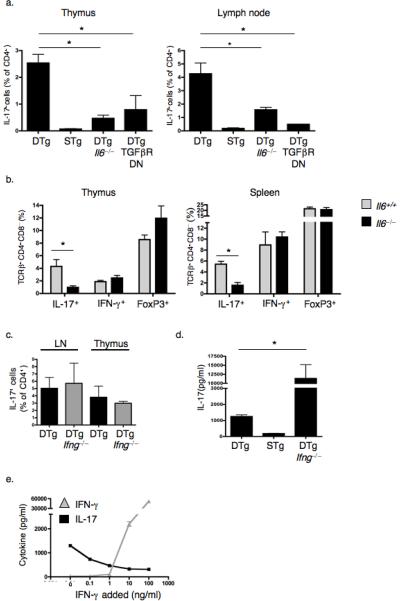
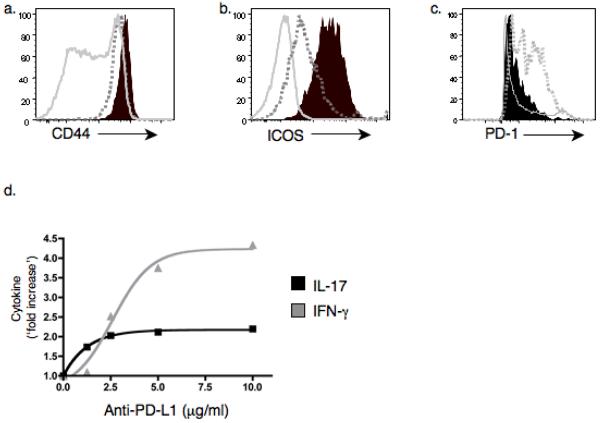
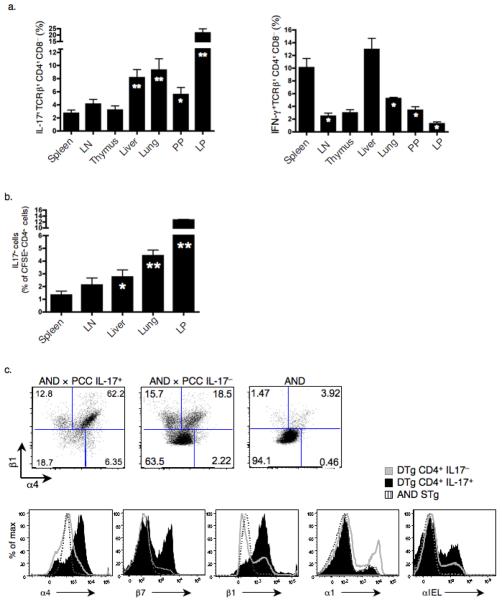
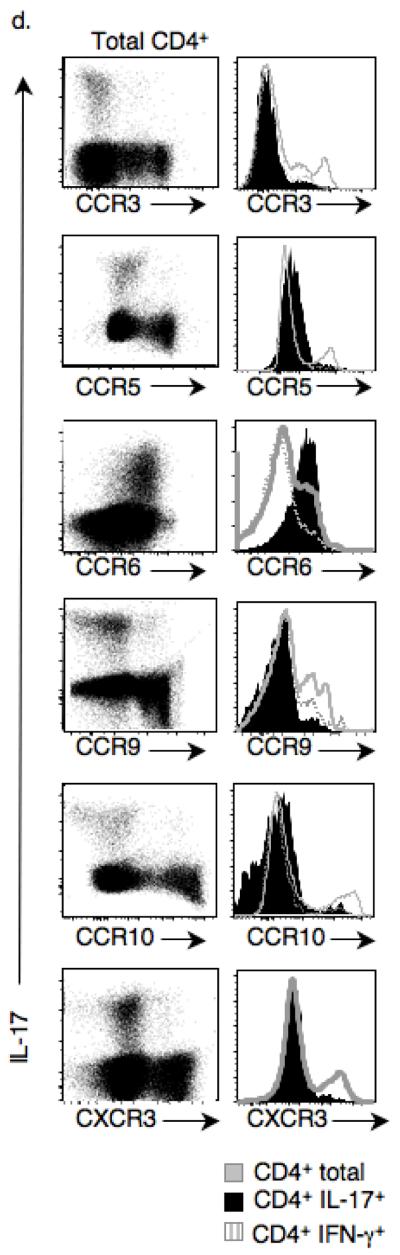
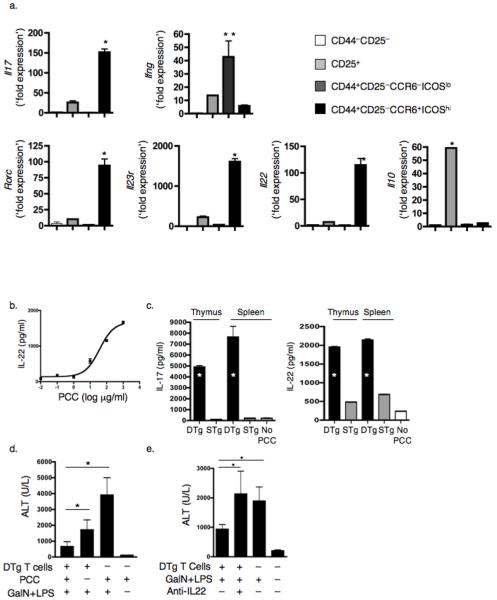
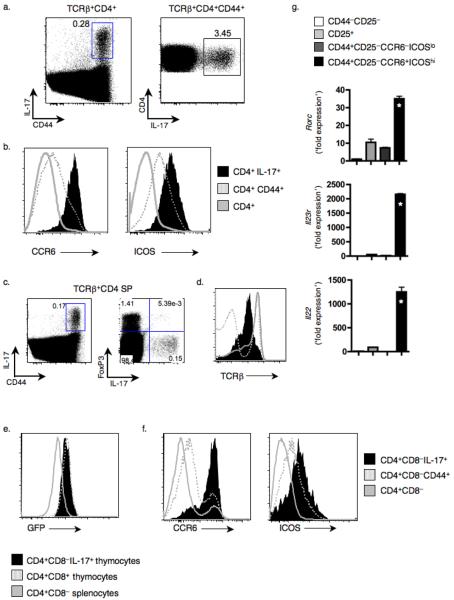
Interleukin 17 (IL-17)-producing CD4(+) helper T cells (T(H)-17 cells) share a developmental relationship with Foxp3(+) regulatory T cells (T(reg) cells). Here we show that a T(H)-17 population differentiates in the thymus in a manner influenced by recognition of self antigen and by the cytokines IL-6 and transforming growth factor-beta (TGF-beta). Like previously described T(H)-17 cells, the T(H)-17 cells that developed in the thymus expressed the transcription factor RORgamma t and the IL-23 receptor. These cells also expressed alpha(4)beta(1) integrins and the chemokine receptor CCR6 and were recruited to the lung, gut and liver. In the liver, these cells secreted IL-22 in response to self antigen and mediated host protection during inflammation. Thus, T(H)-17 cells, like T(reg) cells, can be selected by self antigens in the thymus.


Figures

Figure 1
Figure 1
IL-17+ cells are enriched in peripheral lymphoid organs of AND × PCC DTg mice. (a–c) Splenocytes from indicated mice were analyzed by flow cytometry for percentages of CD4+ T cells (a), activated (CD44hi, CD62Llo) TCRβ+CD4+ cells (b), and CD4+FoxP3+ cells (c). (d) CFSE-labeled CD4+ T cells were cultured with T cell-depleted splenocytes plus the indicated dose of PCC peptide88–104 (left 2 panels). Proliferation profile and proliferation index was measured by CFSE dilution (proliferation index is the average number of divisions of a dividing cell, ignores peak 0). (e) Cytokines in supernatants from cultures of CD4+ T cells and T cell-depleted splenocytes plus 10μg/ml PCC peptide88–104 were analyzed by ELISA (* P ≤ 0.05). (f,g) The percent of IL-17+ compared to IFN-γ+ (f) or IL-17+ versus FoxP3+ splenic TCRβ+CD4+ T cells (g) was assessed by intracellular staining. (h) The percentages of IL-17+, IFN-γ+ and FoxP3+ cells among TCRβ+CD4+ populations from spleens of DTg (gray bars) and STg (black bars) mice were compared (3 mice in each group; * P ≤ 0.05). Data in all panels are representative of at least 3 independent experiments.
Figure 2
Figure 2
TH-17 cells develop in the thymus. (a,b) Intracellular staining was used to determine percentages of IL-17+, FoxP3+ and IFN-γ+ cells among TCRβ+CD4+CD8 thymocytes and splenocytes in DTg and STg mice. Left, representative dot plots. Right, graph showing mean ± s.e.m. of 3 mice in each group. (* P ≤ 0.05) (c,d) TCRβ+CD4+CD8HSA+ thymocytes and TCRβ+CD4+ splenocytes from DTg mice were cultured for 3 d with T cell-depleted splenocytes loaded with 10μg/ml PCC peptide88–104. IL-17 production was analyzed by ELISA (c) and intracellular staining (d). (e) GFP expression in indicated thymocyte subsets from DTg RAG2:GFP mice was measured using flow cytometry. CD4+CD8+ double positive (DP) thymocytes and CD4+ splenocytes were used as positive and negative controls, respectively. (f) Purified CD4+ DTg splenic and LN T cells labeled with CFSE were transferred to wild-type recipients; five days post-transfer, percentages of CFSE+ T cells in the LN, liver, lungs and thymi of recipient mice were determined (3 mice per group). (g) Percentages and absolute numbers of IL-17+, and percentage of IFN-γ+ TCRβ+CD4+ cells within the thymi and LN of AND × TA.TIM (TTg), AND STg and wild-type mice were determined by flow cytometry and cell counting. * P ≤ 0.05 comparing TTg to STg; 6 TTg, 4 STg, and 5 wild-type mice were analyzed. Data are representative of 3 (a,b,g) or 2 (c–f) independent experiments.
Figure 3
Figure 3
Thymic TH-17 development depends upon basal IL-6 and TGF-β production, whereas IFN-γ is inhibitory during peripheral activation. (a) Percentages of TCRβ+CD4+CD8IL-17+ cells in thymi and LN of Il6−/− and CD4dnTGFβRII (TGFβRDN) mice were determined by flow cytometry. (b) The percentages of IL-17+, IFN-γ+, and FoxP3+ cells among TCRβ+CD4+CD8 thymocytes and splenocytes were compared between Il6+/+ and Il6−/− DTg mice. (c) Percentages of TCRβ+CD4+CD8IL-17+ cells were determined in thymi and LN of Ifng−/− DTg mice. Graphs in a–c show mean ± s.e.m. of a minimum of 3 mice of each genotype. * P ≤ 0.05 (d,e) IL-17 in supernatants of splenocytes from DTg, STg and DTg Ifng−/− mice cultured with 10μg/ml PCC peptide88–104 (d, * P ≤ 0.05) or from DTg mice cultured with peptide plus titrated doses of IFN-γ (e). Data are representative of 3 (a,b) or 2 (c–e) independent experiments.
Figure 4
Figure 4
TH-17 cells from DTg mice express CD44, ICOS but not PD-1. (a–c) CD44, ICOS, and PD-1 were measured by flow cytometry on splenic IL-17+ (black fill), IFN-γ+ (dotted gray) and total CD4+ T cells (solid gray). In b, solid gray represents naïve CD4+CD44 cells. (d) Purified CD4+ T cells from DTg mice were cultured for 3 d with T depleted splenocytes and 10μg/ml PCC peptide88–104 in the presence of a range of concentrations of PD-L1 blocking antibody (clone MIH5). IL-17 and IFN-γ in supernatants was measured by ELISA. Data are representative of 3 (a–c) or 2 (d) independent experiments.
Figure 5
Figure 5
TH-17 cells from DTg mice express CCR6, integrins α4β1, and are enriched in the lamina propria (LP), liver, lung, and Peyer's patches (PP). (a) Percentage of IL-17+or IFN-γ+ cells among TCRβ+CD4+CD8 cells from organs of DTg mice, as measured by intracellular staining (* P ≤ 0.05, ** P ≤ 0.005 compared to spleen). Data represent results from a minimum of 3 mice. (b) Purified splenic and LN CD4+ DTg T cells labeled with CFSE were transferred to wild-type recipients and percentages of IL-17+ cells among CFSE+CD4+ cells were measured in peripheral organs at two days post transfer (* P ≤ 0.05, ** P ≤ 0.005). Data is composite of 3 separate transfer experiments, each using 4 mice per group, with data points combined for statistical analysis. (c) Surface expression of α4, β1, β7, α1 and αIEL integrins on splenic CD4+IL-17+ and CD4+IL-17 DTg cells and on CD4+ STg cells was measured by flow cytometry. (d) Expression of CCR3, CCR5, CCR6, CCR9, CCR10 and CXCR3 on CD4+IL-17+, CD4+IFN-γ+ and total CD4+ T cells taken from DTg mice was measured by flow cytometry. Data are representative of 2 (a) or 3 (c,d) independent experiments.
Figure 5
Figure 5
TH-17 cells from DTg mice express CCR6, integrins α4β1, and are enriched in the lamina propria (LP), liver, lung, and Peyer's patches (PP). (a) Percentage of IL-17+or IFN-γ+ cells among TCRβ+CD4+CD8 cells from organs of DTg mice, as measured by intracellular staining (* P ≤ 0.05, ** P ≤ 0.005 compared to spleen). Data represent results from a minimum of 3 mice. (b) Purified splenic and LN CD4+ DTg T cells labeled with CFSE were transferred to wild-type recipients and percentages of IL-17+ cells among CFSE+CD4+ cells were measured in peripheral organs at two days post transfer (* P ≤ 0.05, ** P ≤ 0.005). Data is composite of 3 separate transfer experiments, each using 4 mice per group, with data points combined for statistical analysis. (c) Surface expression of α4, β1, β7, α1 and αIEL integrins on splenic CD4+IL-17+ and CD4+IL-17 DTg cells and on CD4+ STg cells was measured by flow cytometry. (d) Expression of CCR3, CCR5, CCR6, CCR9, CCR10 and CXCR3 on CD4+IL-17+, CD4+IFN-γ+ and total CD4+ T cells taken from DTg mice was measured by flow cytometry. Data are representative of 2 (a) or 3 (c,d) independent experiments.
Figure 6
Figure 6
TH-17 cells from DTg mice produce IL-22 that promotes hepatocyte survival during inflammation. (a) Splenic and LN CD4+ T cells were sorted into the indicates subsets, and mRNA transcripts were measured by Q-PCR, with the ratio of gene to β-actin expression determined by the relative quantification method (ΔΔCT) (* P ≤ 0.05, compared to 3 other groups; ** P ≤ 0.05, compared to naive). (b,c) IL-22 was measured by ELISA in supernatants of DTg splenocytes cultured for 3 d with increasing concentrations of PCC peptide88–104 (b) and, along with IL-17, from cultures of CD4+ splenocytes or thymocytes from DTg and STg mice cultured with 10μg/ml PCC peptide88–104 (c). (* P ≤ 0.05, compared to concentrations from STg supernatants) (d,e) Serum aspartate aminotransferase (ALT) was measured in sera taken from mice 5 h post GalN+LPS treatment, with or without 48 h prior administration of CD25+-depleted CD4+ T cells from DTg mice (d; * P ≤ 0.05), and with or without 2 h pre-treatment with anti-IL-22 (e; * P ≤ 0.05; ). Data are representative of 2 (b,c) or a combination of 3 (d,e) experiments, the latter totaling 12 mice per group, with data points combined for statistical analysis.
Figure 7
Figure 7
TH-17 cells in LN and thymi of wild-type mice have a phenotype identical to TH-17 cells found in DTg mice. (a) Following CD4+ T cell enrichment, TH-17 population size in LN of wild-type B10.BR mice was assessed by intracellular cytokine staining of TCRβ+CD4+ or TCRβ+CD4+CD44+ cells. (b) CCR6 and ICOS expression on the indicated subsets of LN cells of wild-type mice was measured by flow cytometry. (c) CD44 and IL-17 expression by TCRβ+CD4+CD8 thymocytes from wild-type B10.BR mice. (d) Expression of TCRβ on the indicated subsets from wild-type mice was measured by flow cytometry. (e) GFP expression in populations isolated from RAG2:GFP mice was evaluated using flow cytometry. Thymic TCRβ+DP cells and splenic TCRβ+CD4+ cells were used as positive and negative controls, respectively. (f) CCR6 and ICOS expression on the indicated subsets from wild-type mice was measured by flow cytometry. Data (a–f) are representative of 3 independent experiments. (g) Thymocytes from wild-type mice were sorted into the indicated populations and mRNA transcripts were measured using Q-PCR, with the ratio of gene to Hprt1 expression determined by the relative quantification method (ΔΔCT) (* P ≤ 0.05; compared to 3 other groups, with data compiled from 3 replicates using 1 cell sort by flow cytometry).

Comment in

Similar articles

Cited by

References

    1. Murphy KM, Reiner SL. The lineage decisions of helper T cells. Nat Rev Immunol. 2002;2:933–944. - PubMed
    1. Abbas AK, Murphy KM, Sher A. Functional diversity of helper T lymphocytes. Nature. 1996;383:787–793. - PubMed
    1. Harrington LE, Mangan PR, Weaver CT. Expanding the effector CD4 T-cell repertoire: the Th17 lineage. Curr Opin Immunol. 2006;18:349–356. - PubMed
    1. Aggarwal S, Ghilardi N, Xie MH, de Sauvage FJ, Gurney AL. Interleukin-23 promotes a distinct CD4 T cell activation state characterized by the production of interleukin-17. J Biol Chem. 2003;278:1910–1914. - PubMed
    1. Ivanov, et al. The orphan nuclear receptor RORgammat directs the differentiation program of proinflammatory IL-17+ T helper cells. Cell. 2006;126:1121–1133. - PubMed

Publication types

MeSH terms