. 2009 Oct;6(10):745-51.
doi: 10.1038/nmeth.1370. Epub 2009 Sep 6.

Large-scale sorting of C. elegans embryos reveals the dynamics of small RNA expression

Affiliations

Large-scale sorting of C. elegans embryos reveals the dynamics of small RNA expression

Marlon Stoeckius et al. Nat Methods. 2009 Oct.

Abstract

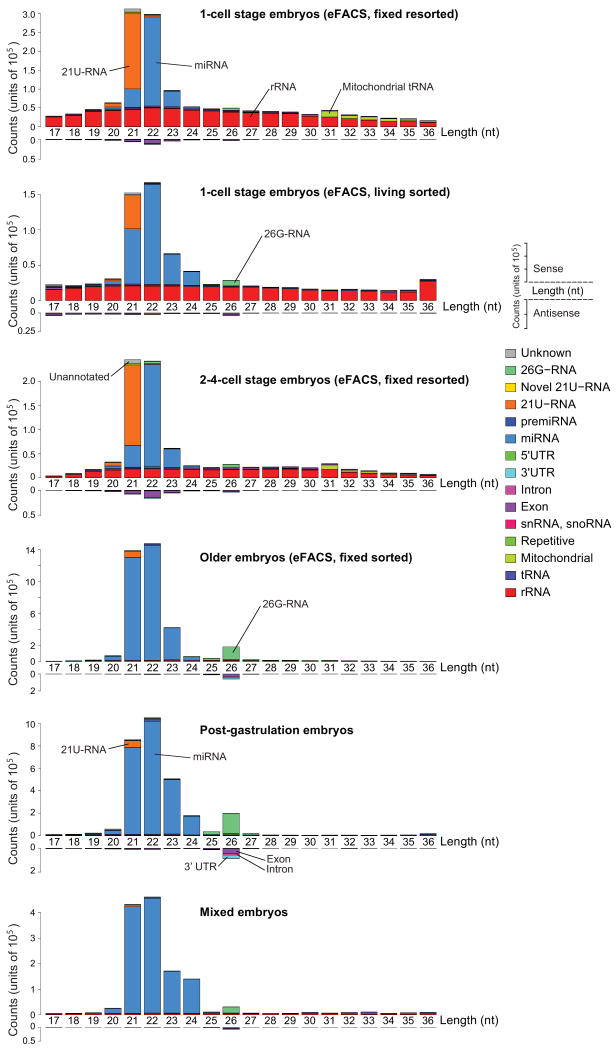
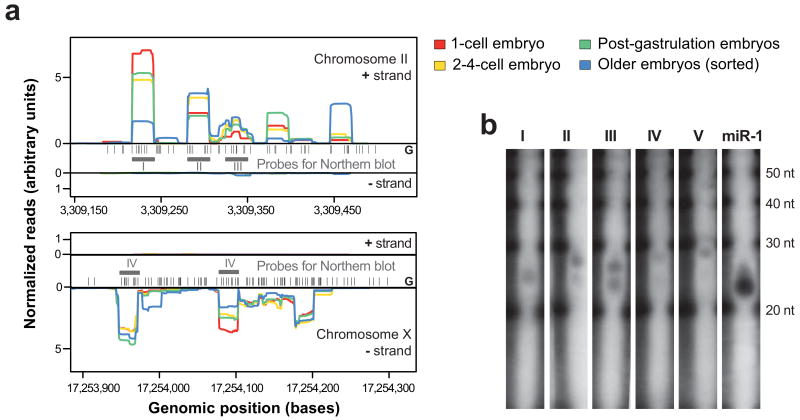
Caenorhabditis elegans is one of the most prominent model systems for embryogenesis, but collecting many precisely staged embryos has been impractical. Thus, early C. elegans embryogenesis has not been amenable to most high-throughput genomics or biochemistry assays. To overcome this problem, we devised a method to collect staged C. elegans embryos by fluorescence-activated cell sorting (eFACS). In a proof-of-principle experiment, we found that a single eFACS run routinely yielded tens of thousands of almost perfectly staged 1-cell stage embryos. As the earliest embryonic events are driven by posttranscriptional regulation, we combined eFACS with second-generation sequencing to profile the embryonic expression of small, noncoding RNAs. We discovered complex and orchestrated changes in the expression between and within almost all classes of small RNAs, including microRNAs and 26G-RNAs, during embryogenesis.


Figures

Figure 1
Figure 1
eFACS yields tens of thousands of cleanly staged one-cell embryos with at least 98% purity. (a) A mixed population of embryos from the OMA-1::GFP strain is passed through a Fluorescent Activated Cell Sorter (FACS). Shown is the GFP fluorescent signal vs autofluorescence. One-cell embryos with a high GFP signal (3-5% of the initial population) are selected (*). 10,000 embryos are depicted in the scatter plot. (b) The first sort enriches the one-cell stage embryo population to ∼70%. 2,000 embryos are depicted in the scatter plot. Sorting once more (resorting) the same population (**) yields one-cell embryos at a purity of >98% (see below). (c) Developmental stage analysis of resorted embryos of a randomly selected sample (96 embryos). DAPI stained pronuclei appear black. All embryos are one-cell stage. Scale bars, 25μm. (d) RT-PCR analysis of once-sorted (*), Resorted embryos (**), and a mixed embryo population prior to sorting. In resorted embryos the one-cell stage specific marker genes oma-1 and oma-2 but not early zygotic (four-to-eight-cell stage) genes med-1 and end-1 are amplified. However, in embryos that were sorted only once, expression of med-1 and end-1 is still detectable. Act-1 was used as RT-PCR control. (e) Summary statistics of microscopic analyses of resorted embryos. The majority of embryos are in the pseudocleavage and chromosome condensation phase (30%) and in the pronuclear migration phase (30%) of the first cell cycle. Two-cell and older embryos represent less than 2% of the resorted embryo population (Error bars, s.d., n = 5, 100 embryos counted per replicate).
Figure 2
Figure 2
Dissecting small RNA expression during embryogenesis. Summary of the six samples used for small RNA cloning and next-generation sequencing (Illumina). Two different one-cell stage samples were obtained by embryo Fluorescent Activated Cell Sorting (eFACS): (i) The living-sorted one-cell stage embryo sample represents a mixed embryo sample enriched in one-cell stage embryos. (ii) The vast majority of the fixed and twice-sorted (resorted) one-cell stage embryo sample consists of one-cell embryos (>98%) in which embryos are mainly in very early phases of their first cell cycle (Fig. 1). The two-to-four-cell stage sample was obtained by resorting fixed embryos and represents a mixture of one-cell to eight-cell embryos strongly enriched in two-to-four-cell stage embryos (Supplementary Fig. 1). Two older embryo populations were generated by (i) eFACS of GFP negative embryos, which represent a mixed embryo population depleted in early embryos and by (ii) harvesting post gastrulation embryos by allowing isolated embryos to develop for 3 hours at 20°C. Finally, also a mixed embryo population was obtained. The total number of successfully mapped small RNAs in each sample is tabulated to the right.
Figure 3
Figure 3
FACS sorting of fixed one-cell embryos can be used to reveal miRNA expression dynamics. (a) Scatter plot of miRNA expression quantified by normalized sequencing reads in the fixed resorted one-cell stage embryos (>98% purity) versus the live-sorted sample (∼70% one-cell embryos, ∼30% older embryos). The graph reveals a high correlation (Pearson 0.86) but considerable scatter and some miRNAs that seem exclusively expressed in only one of the samples (grey dots). Grey dashed line: main diagonal. (b) miRNA expression of live- and fixed-sorted one-cell stage embryos after in silico subtraction of miRNA expression in mixed embryos correlate almost perfectly (Pearson 0.94). The plot shows all miRNAs with higher expression in the one-cell embryos compared to the mixed embryos. Virtually all of these (linear regression, orange line) reside above the diagonal (grey dashed line) demonstrating the higher enrichment of one-cell specific miRNAs in the fixed-sorted sample. (c) Fold changes of miRNA expression between the one-cell stage embryos to post-gastrulation embryos as quantified by deep sequencing is shown in a double-logarithmic scatter plot. Orange line: linear regression. Dotted lines: 2 fold change. (d) qRT-PCRs for selected miRNAs (marked in red in (c)) were performed to assay miRNA fold changes on living, hand-picked embryos. Fold changes obtained by sequencing are plotted versus fold changes obtained by qRT-PCRs (Pearson 0.85). Coordinated expression fold changes are observed within the miRNA clusters miR-35 and miRNA-42 (Supplementary Fig. 3). Error bars s.d. (n=3).
Figure 4
Figure 4
Abundance of small RNAs during embryogenesis. Overall composition of different classes of small RNAs at different developmental stages obtained by deep sequencing. Small RNA categories were ordered by their overall abundance in all samples (miRNA > rRNA > 21U-RNA > tRNA > exons > 26G-RNA > mitochondrial > introns > 3′UTR > sn- & snoRNA > unknown). The relative abundance of different classes of small RNAs during embryogenesis is dynamic and appears to be regulated. The relative abundance of small RNAs in mixed embryos convolutes specific changes in small RNA expression during embryogenesis.
Figure 5
Figure 5
Differential expression between and within almost all classes of small RNAs during embryogenesis. Small RNA length distribution at different developmental stages. The relatively small number of sequencing reads that mapped anti-sense to known transcripts is plotted below the horizontal axis. Many of these reads are most likely endogenous siRNAs (see text). The transcript length profiles for all other reads show distinct characteristic features for the different small RNA classes. tRNAs and rRNAs have uniform length distributions while the length of miRNAs and 21U-RNAs peak around 22 and 21 nucleotides, respectively. ∼60% all known miRNAs are already detected in the one-cell embryo. In the one-cell embryo, reads mapping to rRNAs are highly expressed, drop in expression in the two-to-four-cell embryos, and are virtually absent in older embryos. 21U-RNAs are very abundant in the early embryo. 26G-RNAs were most highly expressed in older embryos. The older embryo samples are dominated by miRNAs, followed by 26G-RNAs and reads of length 26 nt that mapped anti-sense to known mRNAs. The live sorted one-cell stage sample, which is contaminated with older embryos, exhibits features from the early embryo samples (21U-RNA, rRNA) as well as the older embryos (26G-RNA).
Figure 6
Figure 6
26G-RNAs are expressed from intergenic clusters (a) Two genomic clusters of 26G-RNAs on chromosome II and chromosome X. We observed most of the reads from one strand in our embryo samples. Black bars represent the positions of 5′ Guanine nucleotides in the genome. Grey bars and roman numerals indicate the features for which Northern blots were performed. Profiles are normalized to yield identical areas under the sense strand curves. (b) Validation of five (out of five tested) 26G-RNAs by Northern blots with total RNA from mixed embryos. The observed transcript lengths vary slightly between 24-28 nt. Some of the tested probes exhibit a double band in the Northern blots (II, III, IV), while others (I and V) exhibit only a single band. A 21 nt probe for miR-1 was used as a positive control.

Comment in

  • Automated sorting of live C. elegans using laFACS.
    Fernandez AG, Mis EK, Bargmann BO, Birnbaum KD, Piano F. Fernandez AG, et al. Nat Methods. 2010 Jun;7(6):417-8. doi: 10.1038/nmeth.f.304. Epub 2010 May 2. Nat Methods. 2010. PMID: 20436474 Free PMC article. No abstract available.

References

    1. Sulston JE, Schierenberg E, White JG, Thomson JN. The embryonic cell lineage of the nematode Caenorhabditis elegans. Dev Biol. 1983;100:64–119. - PubMed
    1. Piano F, et al. RNAi analysis of genes expressed in the ovary of Caenorhabditis elegans. Curr Biol. 2000;10:1619–1622. - PubMed
    1. Piano F, et al. Gene clustering based on RNAi phenotypes of ovary-enriched genes in C. elegans. Curr Biol. 2002;12:1959–1964. - PubMed
    1. Kamath RS, et al. Systematic functional analysis of the Caenorhabditis elegans genome using RNAi. Nature. 2003;421:231–237. - PubMed
    1. Gonczy P, Rose LS. Asymmetric cell division and axis formation in the embryo. WormBook. 2005:1–20. - PMC - PubMed

Publication types

MeSH terms

Substances