. 2009 Oct;15(10):1202-7.
doi: 10.1038/nm.2023. Epub 2009 Sep 6.

Inhibition of calpain increases LIS1 expression and partially rescues in vivo phenotypes in a mouse model of lissencephaly

Affiliations

Inhibition of calpain increases LIS1 expression and partially rescues in vivo phenotypes in a mouse model of lissencephaly

Masami Yamada et al. Nat Med. 2009 Oct.

Abstract

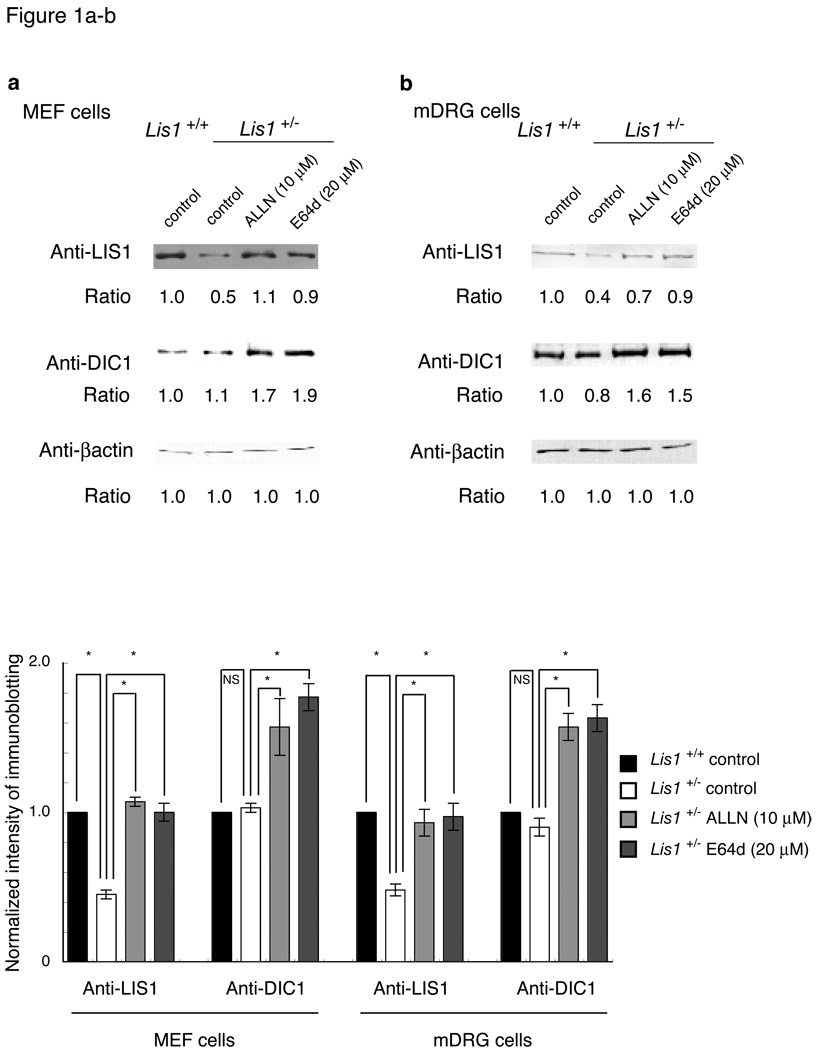
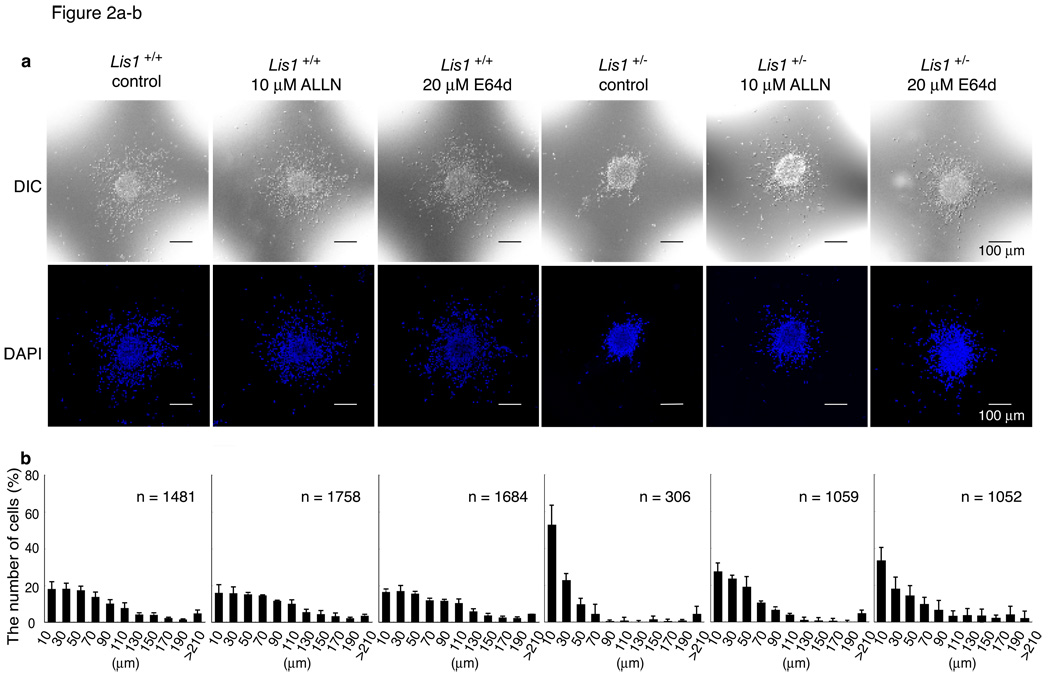
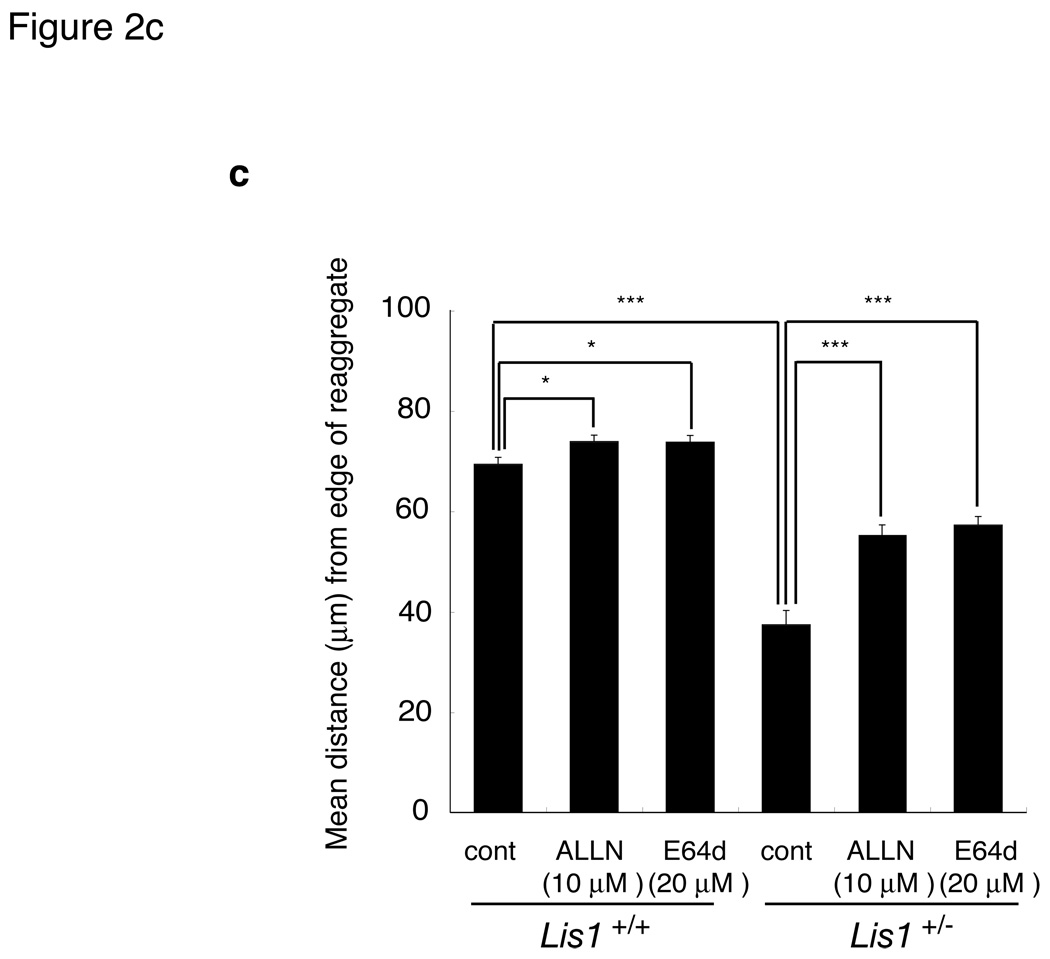
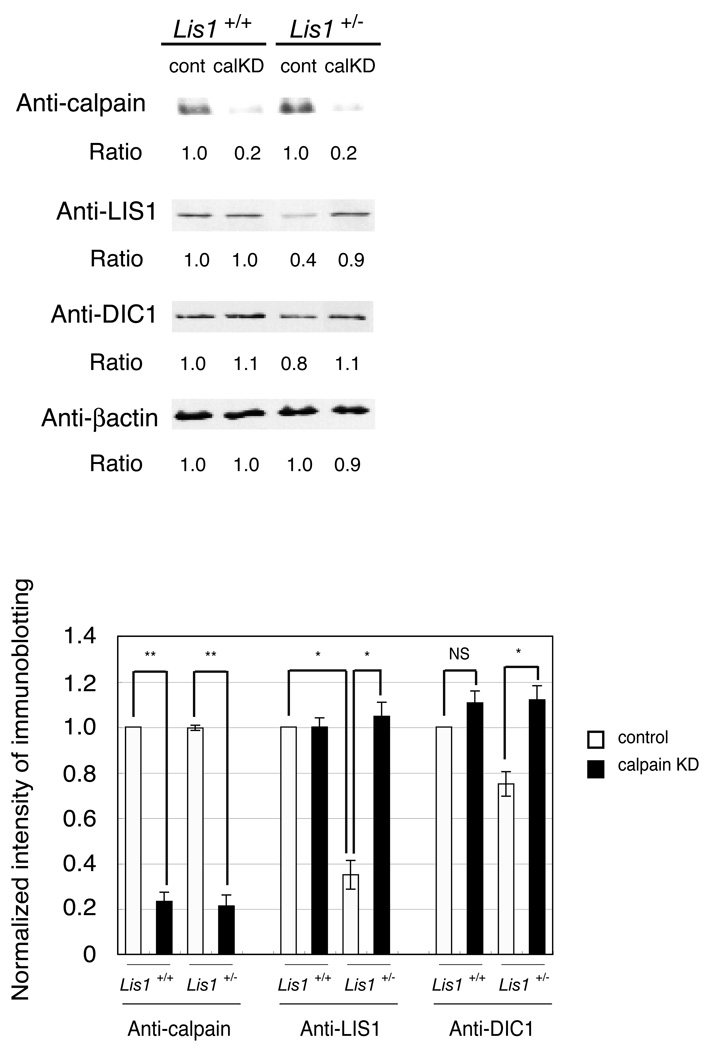
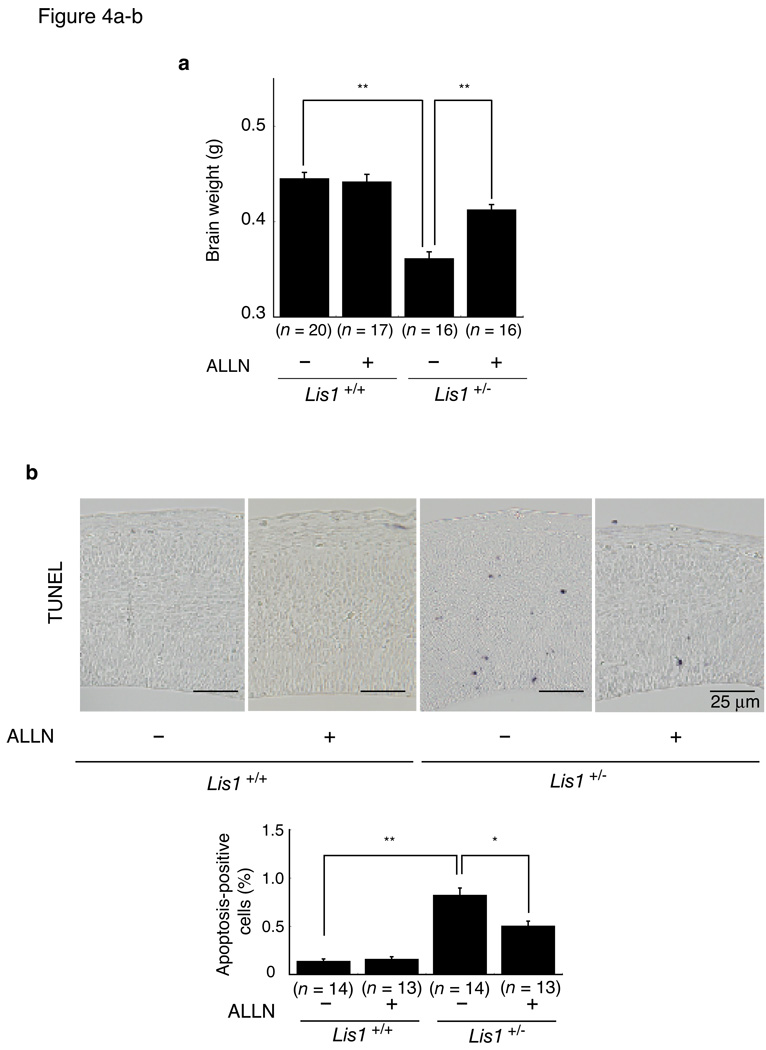
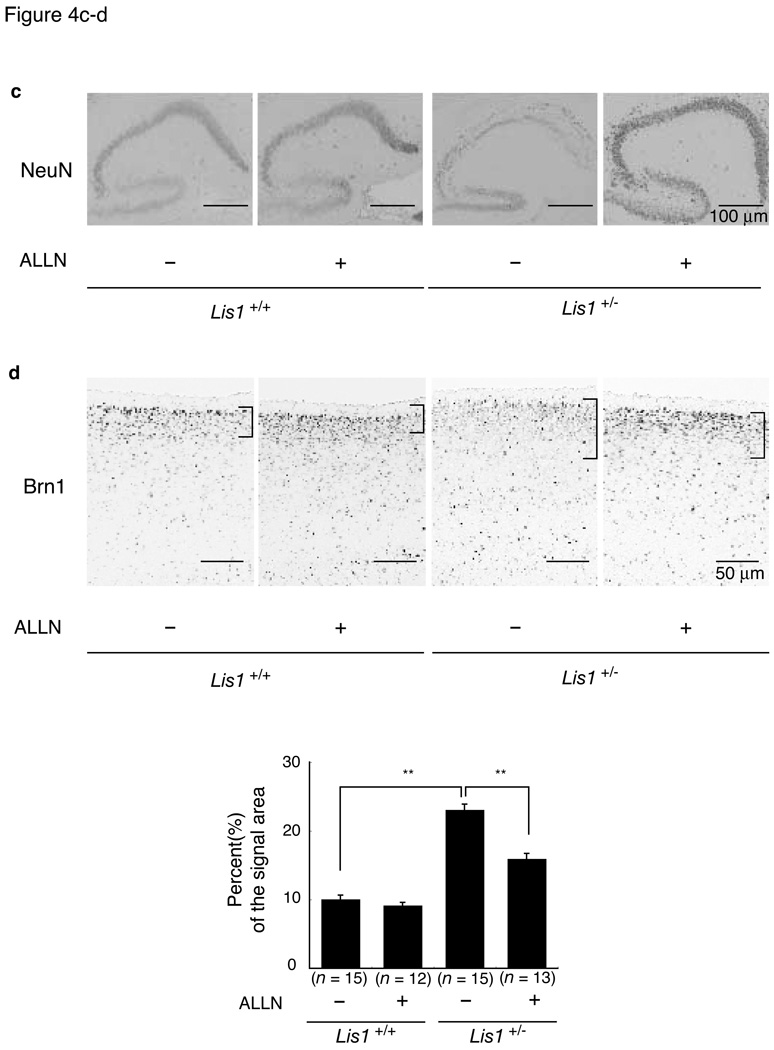
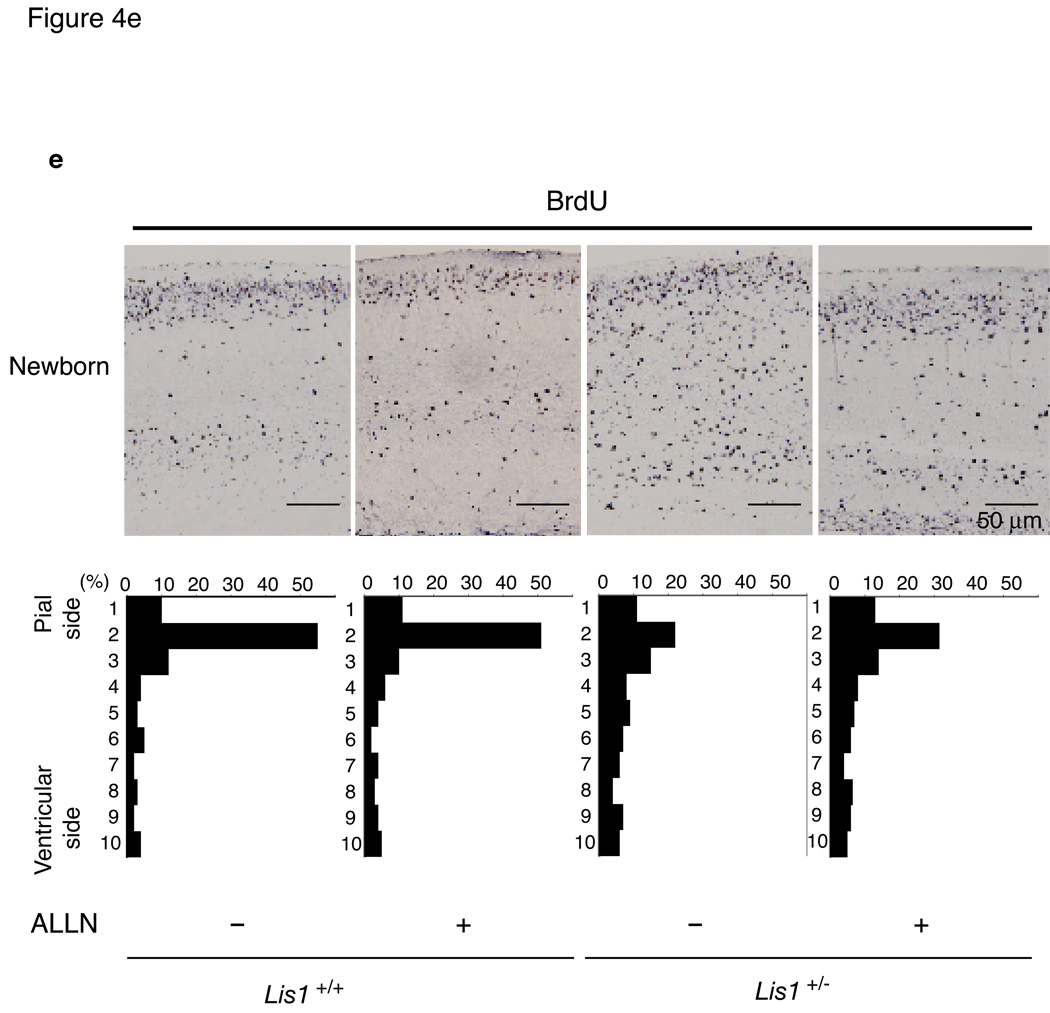
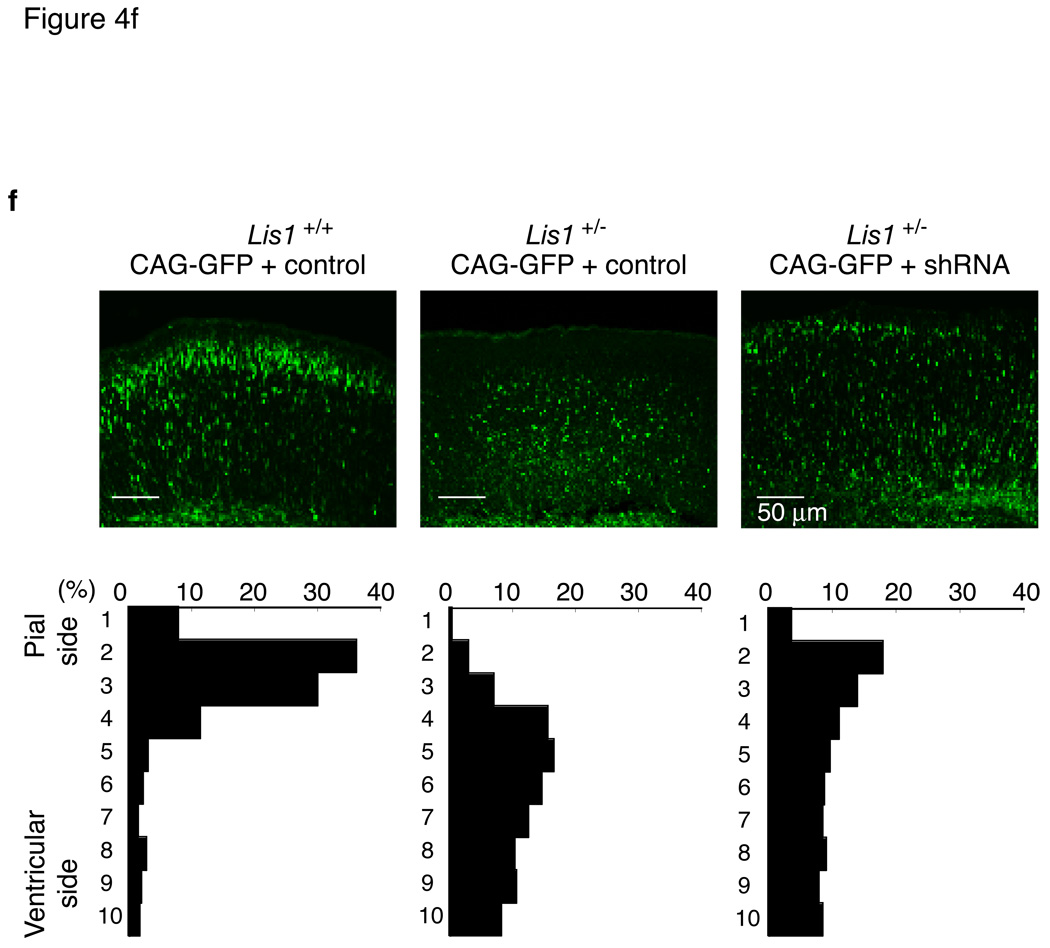
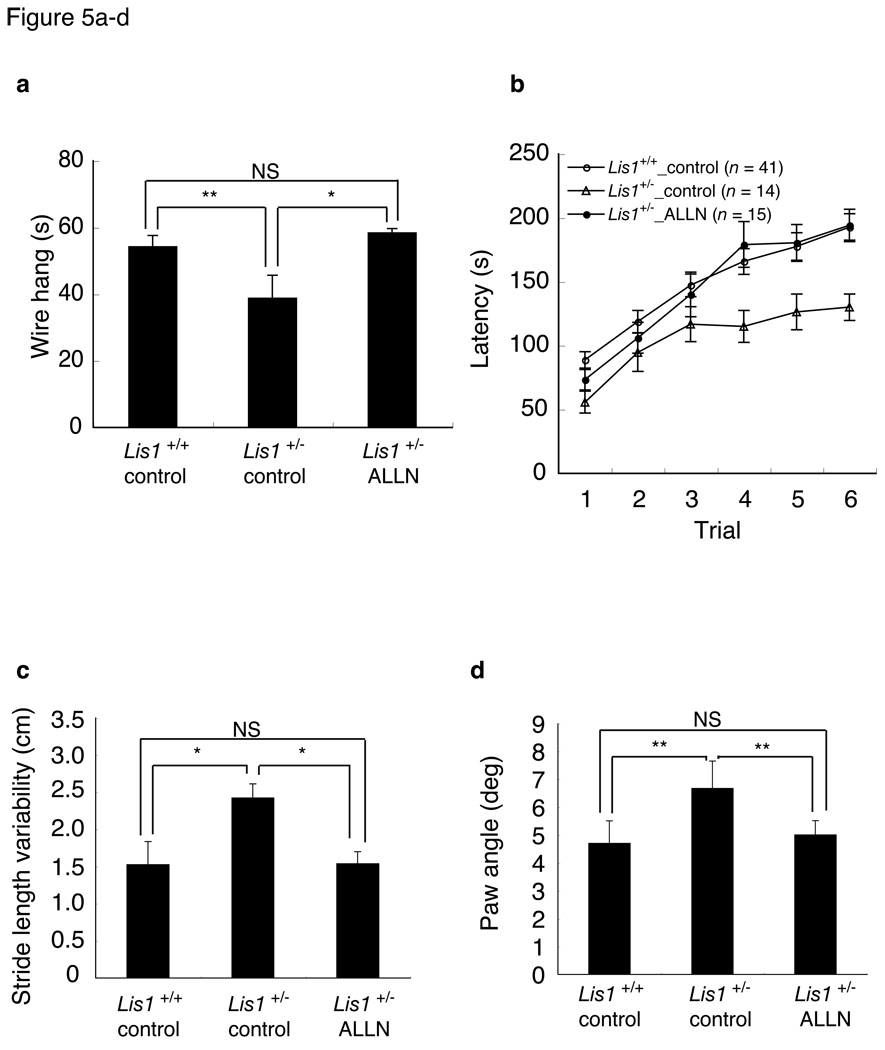
Lissencephaly is a devastating neurological disorder caused by defective neuronal migration. LIS1 (official symbol PAFAH1B1, for platelet-activating factor acetylhydrolase, isoform 1b, subunit 1) was identified as the gene mutated in individuals with lissencephaly, and it was found to regulate cytoplasmic dynein function and localization. Here we show that inhibition or knockdown of calpains protects LIS1 from proteolysis, resulting in the augmentation of LIS1 amounts in Lis1(+/-) mouse embryonic fibroblast cells and rescue of the aberrant distribution of cytoplasmic dynein, mitochondria and beta-COP-positive vesicles. We also show that calpain inhibitors improve neuronal migration of Lis1(+/-) cerebellar granular neurons. Intraperitoneal injection of the calpain inhibitor ALLN to pregnant Lis1(+/-) dams rescued apoptotic neuronal cell death and neuronal migration defects in Lis1(+/-) offspring. Furthermore, in utero knockdown of calpain by short hairpin RNA rescued defective cortical layering in Lis1(+/-) mice. Thus, calpain inhibition is a potential therapeutic intervention for lissencephaly.


Figures

Figure 1
Figure 1. Western blotting analysis and distribution of LIS1, dynein intermediate chain (DIC1), and cellular components after administration of calpain inhibitors in MEF cells
We examined LIS1 or DIC1 protein level after administration of 10 µM ALLN or 20 µM E64d by Western blotting in mouse embryonic fibroblast (MEF) cells (a) or dorsal root ganglia (DRG) neurons (b). Western blotting was performed 2 hrs after the start of treatment. Protein levels were normalized by comparison with the β-actin control and are indicated at the bottom of each panel. Statistical examination was performed by unpaired Student’s t-test, which is shown at the bottom, with *P<0.05. Error bars in graphs were expressed as mean±SEM. We performed three independent sets of experiments. One representative data set is shown. Note: LIS1 and DIC1 were augmented by ALLN or E64d treatment.
Figure 2
Figure 2. Rescue of neuronal migration by administration of calpain inhibitors
Migration assay using cerebellar granule neurons. Images of granule neuron clusters are shown (a). The migration distance of each neuron 16 hrs after 10 µM ALLN or 20 µM E64d treatment was binned (b). Wild type neurons displayed normal migration distances, whereas Lis1+/− neurons displayed a shift in the distribution of bins toward the left. Lis1+/− neurons in the presence of 10 µM ALLN or 20 µM E64d clearly showed improvement of migration defects. Mean migration distances are summarized at the bottom (c). n is the number of neurons measured for each examination. Statistical analysis was performed by the unpaired Student’s t-test, with *P<0.05 and ***P<0.001. Error bars in graphs were expressed as mean±SEM. We performed three independent sets of experiments, and obtained reproducible results. Note; calpain inhibitors moderately facilitated neuronal migration in wild type cells, and rescued defective neuronal migrations in Lis1+/− neurons.
Figure 3
Figure 3. Knockdown of calpain by siRNA
MEF cells were transfected with siRNA against calpain small subunit 1 (Capns1). Western blotting was performed 120 hrs after transfection of siRNA. Note: depletion of calpain small subunit 1 resulted in reduction of μ-calpain and m-calpain accompanied by increase of LIS1 and DIC1. Statistical analysis was performed by the unpaired Student’s t-test, which is shown at the bottom, with *P<0.05 or **P<0.01. We performed three independent sets of experiments. One representative data set is shown.
Figure 4
Figure 4. Rescue of defective corticogenesis in Lis1+/− mice by intra-peritoneal injection of ALLN
(a) Measurement of brain weight at d5. Genotyping and injection of ALLN are indicated at the bottom. n is the number of brains examined. All statistical analyses were performed by the unpaired Student’s t-test. Error bars: ±SEM. Statistical significance was defined as *P<0.05 or **P<0.01. (b) Apoptotic cell death was examined by TUNEL staining at E15.5. Histogram plots of the relative frequency of TUNEL positive cell to the total number of cells are shown at the bottom. n is the number of brains examined. Error bars: ±SEM. (c) Neu-N staining of mid-sagittal sections of the hippocampus is shown. Severe cell dispersion and splitting of CA3 region were observed in the Lis1+/− mouse. (d) Cortical phenotypes were examined by a layer specific maker, Brn-1 (layer 2 and 3). The distribution of Brn-1 positive cells is indicated at the right side of each panel. Quantitation of the thickness of Brn-1 positive cells is summarized at the bottom. n is the number of brains examined. Error bars: ±SEM. (e) BrdU birthdating analysis Quantitative analysis was performed by measuring the distribution of BrdU labeled cells in each bin that equally divided the cortex from ML to SP. (f) In utero injection of shRNA against Capns1. The distribution of migrated neurons is shown at lower panels. Cortex was divided into ten compartments, followed by counting of the neurons located at each compartment, and summarized.
Figure 5
Figure 5. Rescue of impaired behavior in Lis1+/− mice by intra-peritoneal injection of ALLN
Neurological screen: wire hang test (a). Note: there were no obvious differences in body weight, rectal temperature (Supplementary Table 1) and grip strength in each group. Lis1+/− mice displayed clear shorter time to falling in the wire hang test. P-values are shown at the upper parts of bars. Statistical analysis was conducted using Stat View (SAS institute). Data were analyzed by two-way ANOVA. Error bars in graphs were expressed as mean±SEM. All P-values indicated are two tailed. Statistical significance was defined as *P<0.05 or **P<0.01. (b) Examination of motor function by the rotarod test. Time spent balanced on top of the rotating rod was measured across six test trials for Lis1+/+ mice (open circle), Lis1+/− mice without ALLN treatment (open triangle) and Lis1+/− mice with ALLN treatment (closed circle). Significant differences between Lis1+/+ mice and Lis1+/− mice (***P<0.001) were observed. Lis1+/− mice with ALLN treatment displayed improvement of rotarod performance. Data were analyzed by two-way repeated measures. (c) Examination of stride length variability and (d) fore paw angle in gait analysis. Lis1+/− mice with ALLN treatment displayed improvement of gait parameters. Data were analyzed by two-way ANOVA.

Similar articles

Cited by

References

    1. Reiner O, et al. Isolation of a Miller-Dieker lissencephaly gene containing G protein beta-subunit-like repeats. Nature. 1993;364:717–721. - PubMed
    1. Gleeson JG, et al. Doublecortin, a brain-specific gene mutated in human X-linked lissencephaly and double cortex syndrome, encodes a putative signaling protein. Cell. 1998;92:63–72. - PubMed
    1. Pilz DT, et al. LIS1 and XLIS (DCX) mutations cause most classical lissencephaly, but different patterns of malformation. Hum Mol Genet. 1998;7:2029–2037. - PubMed
    1. Hirotsune S, et al. Graded reduction of Pafah1b1 (Lis1) activity results in neuronal migration defects and early embryonic lethality. Nat Genet. 1998;19:333–339. - PubMed
    1. Hattori M, Adachi H, Tsujimoto M, Arai H, Inoue K. Miller-Dieker lissencephaly gene encodes a subunit of brain platelet-activating factor acetylhydrolase [corrected] Nature. 1994;370:216–218. - PubMed

Publication types

MeSH terms