. 2009 Dec 3;28(48):4237-48.
doi: 10.1038/onc.2009.272. Epub 2009 Sep 7.

A matrix metalloproteinase-1/protease activated receptor-1 signaling axis promotes melanoma invasion and metastasis

Affiliations

A matrix metalloproteinase-1/protease activated receptor-1 signaling axis promotes melanoma invasion and metastasis

J S Blackburn et al. Oncogene. .

Abstract

Hallmarks of malignant melanoma are its propensity to metastasize and its resistance to treatment, giving patients with advanced disease a poor prognosis. The transition of melanoma from non-invasive radial growth phase (RGP) to invasive and metastatically competent vertical growth phase (VGP) is a major step in tumor progression, yet the mechanisms governing this transformation are unknown. Matrix metalloproteinase-1 (MMP-1) is highly expressed by VGP melanomas, and is thought to contribute to melanoma progression by degrading type I collagen within the skin to facilitate melanoma invasion. Protease activated receptor-1 (PAR-1) is activated by MMP-1, and is also expressed by VGP melanomas. However, the effects of MMP-1 signaling through PAR-1 have not been examined in melanoma. Here, we demonstrate that an MMP-1/PAR-1 signaling axis exists in VGP melanoma, and is necessary for melanoma invasion. Introduction of MMP-1 into RGP melanoma cells induced gene expression associated with tumor progression and promoted invasion in vitro, and enhanced tumor growth and conferred metastatic capability in vivo. This study demonstrates that both the type I collagenase and PAR-1 activating functions of MMP-1 are required for melanoma progression, and suggests that MMP-1 may be a major contributor to the transformation of melanoma from non-invasive to malignant disease.


Conflict of interest statement

Conflict of Interest: The authors declare no conflict of interest.

Figures

Figure 1
Figure 1
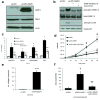
PAR-1 cleavage by MMP-1 occurs in VMM12 VGP melanoma cells. (a) Western blot analysis of MMP-1 protein production by normal melanocytes, Bowes RGP melanoma cells, and VMM12 VGP melanoma cells, and analysis PAR-1 protein expression by normal endothelial cells, Bowes and VMM12 cells. PAR-1 blots were re-probed for actin, as a loading control. MMP-1 band is 54kD, PAR-1 is 61kD, actin is 43kD. (b) VMM12 cells were transfected with AP-PAR1, and treated with media conditioned for 24hr by either Bowes or VMM12 cells. The amount of alkaline phosphatase in the media, due to PAR-1 cleavage, was measured after 1hr. (c) VMM12 conditioned media (CM) were treated with either DMSO, 0.05U/mL hirudin (thrombin inhibitor), 5μM MMP inhibitor II, which blocks activity of MMP-1,-3,-7,-9 or 5μM MMP inhibitor V, which blocks MMP-2,-3,-8,-9,-12,-13 activity. MMP-1 neutralizing antibody or anti-FLAG (IgG control) were added at the indicated concentration to VMM12 CM. Media were used to treat AP-PAR1 transfected VMM12 cells for 1hr. Alkaline phophatase activity was measured to quantify PAR-1 cleavage. *p=0.02 and **p<0.001, compared to anti-FLAG IgG treatment, ***p<0.001, compared to DMSO treatment. (d) Calcium flux in VMM12 cells was measured using Fluro-4-NW dye. Cells were loaded with dye, and then treated for 1hr with 10nM thrombin in serum-free media (positive control) or VMM12 conditioned media (CM). Calcium flow into the cells was measured by quantifying the fluorescence in each well. CM were also treated with DMSO, 1μg/mL anti-FLAG, 0.05 hirudin, 1μg/mL anti-MMP-1, or VMM12 cells were treated with 50nM SCH79797. Because data were not significantly different between VMM12 CM, DMSO and anti-FLAG treatments, results were pooled as “VMM12 CM” to simplify the graph. For all experiments, MMPs in the CM were activated as described, and data are representative of at least 3 individual experiments. #p<0.001, compared to VMM12 CM.
Figure 2
Figure 2
MMP-1 induces gene expression in VMM12 cells via PAR-1 activation. (a) Western blot analysis of MMP-1 and PAR-1 protein production by VMM12 cells stably transfected with scrambled control shRNA (shMAMMX), MMP-1 shRNAs (shMMP-1) and PAR-1 shRNAs (shPAR-1). PAR-1 blots were re-probed for actin, as a loading control. MMP-1 band is 54kD, PAR-1 is 61kD, actin is 43kD. (b) shMAMMX, shMMP-1 and shPAR-1 cells were treated with media conditioned by the same cell line for 24hr, with MMPs activated as described. Gene expression was measured by realtime RT-PCR. *p≤0.002, compared to shMMP-1 gene expression, **p≤0.025, compared to shMAMMX gene expression. (c) shMMP-1 cells were treated with either DMSO (control), 5nM activated MMP-1 or 5nM MMP-1+50nM SCH79797. After 24hr, cells were harvested and gene expression measured by realtime-RT PCR. #p≤0.003 compared to shMMP-1 control, ##p≤0.005, compared to treatment with 5nM MMP-1. For all, data were normalized to GAPDH, and were analyzed by the 2ΔΔC(t) method, and are representative of 3 experiments.
Figure 3
Figure 3
Both the collagenase and PAR-1 activating functions of MMP-1 are required for melanoma cell invasion. (a) VMM12 shRNA lines were used in a type I collagen degradation assay. Cells were embedded in type I collagen, and after 48hr, the media released from the collagen gel were weighed to determine the amount of collagen that had been degraded. #p<0.001, compared to collagen degradation by shMAMMX cells. (b) VMM12 shRNA lines were used in invasion assays. Cells were plated on fluroblock transwells coated with either 1mg/mL type I collagen or 1mg/mL Matrigel, as described in Materials and Methods. The lower chamber was filled with media containing 10% FBS, as a chemoattractant. For some experiments, the shMMP-1 cells were treated with 5nM thrombin in the upper chamber to activate PAR-1. After 24hr, invaded cells were stained with CalceinAM dye. Micrographs shown are representative of at least 3 experiments. Scale bar = 100μm. (c) Quantification of invaded cells from (b), with 3 fields counted per well. Data are representative of 4 individual experiments. *p<0.001, compared to invasion through type I collagen by shMAMMX cells, **p<0.001, compared to invasion through Matrigel by shMAMMX cells, NS, not significant compared to shMAMMX.
Figure 4
Figure 4
MMP-1 expression in Bowes RGP cells induces some aspects of the VGP phenotype in vitro, via PAR-1 activation. (a) Bowes cells were stably transfected with pCMV (empty vector control) or pCMV-MMP1. MMP-1 and PAR-1 protein levels were measured by western blot. PAR-1 blots were re-probed for actin, as a loading control. MMP-1 band is 54kD, PAR-1 is 61kD, actin is 43kD. (b) Bowe-pCMV and Bowes-pCMV-MMP1 cells were serum-starved for 2hr, then treated for 15′ with media from the same cell line, with MMPs activated as described. Media were treated with either DMSO (-), 5μM MMP inhibitor II, or cells were pre-treated with 50nM SCH79797, as indicated. The phosphorylation status of MEK1/2 and p38 were examined by western blot of the cell lysates. Blots were re-probed with antibodies against the corresponding total protein. MEK1/2 band size is 44kD, p38 is 38kD. (c) Realtime RT-PCR was used to measure the expression of selected genes in cells treated with media conditioned by the same cell line, with MMPs activated. Cells were treated with either DMSO or 50nM SCH79797. Data are normalized to GAPDH expression and were analyzed using the 2-ΔΔC(t) method. *p≤0.002, compared to pCMV gene expression, **p≤0.015, compared to Bowes-MMP1 gene expression. (d) Cells were plated in media conditioned by the same cell line, with MMPs activated, and viable cells were counted after 48, 96, and 144hr. Cells were treated with either DMSO or 50μM SCH79797. #p<0.001, compared to pCMV-MMP1+SCH79797. (e) Cells were used in a type I collagen degradation assay. Media released due to collagen degradation were quantified after 48hr. ***p<0.001, compared to pCMV transfected cells. (f) Cells were plated in type I collagen invasion assays as described. Cells were treated with either DMSO or 50nM SCH79797. †p<0.001, compared to Bowes-pCMV, ††p<0.001, compared to Bowes-pCMV-MMP1. All data shown are representative of 4 individual experiments.
Figure 5
Figure 5
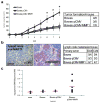
MMP-1 expression in Bowes RGP cells promotes tumor growth and metastasis. (a) Bowes, Bowes-pCMV and Bowes-pCMV-MMP1 cells were injected intradermally into nude mice (106 cells/injection). Tumor incidence was noted (table) and tumors were measured weekly with calipers. *p<0.01, compared to Bowes-pCMV. (b) Draning (DLN) and contralateral (CLN) lymph nodes from tumor bearing mice were stained with anti-human MART-1. Micrographs are representative of DLN from each group. Scale bar=100μm. Lymph nodes positive for MART-1 staining were quantified (table). (c) ALU PCR was performed as described to quantify the amount of human DNA in the lungs of tumor bearing mice. Naïve mice were used as a negative control. Each point represents a sample from one mouse. Horizontal lines are the average for each group. Note that the data are in log scale.
Figure 6
Figure 6
Factors in the tumor microenvironment may induce MMP-1 expression in Bowes RGP melanoma cells, and MMP-1 strongly induces MMP-1 expression via PAR-1. (a) Bowes cells were treated for 24hr in serum-free media with 5nM thrombin, 25ng/mL bFGF, 10ng/mL VEGF. MMP-1 expression was measured by realtime-RT PCR. Data were normalized to GAPDH, and analyzed by the 2ΔΔC(t) method. *p=0.015, **p=0.002, ***p=0.042, compared to control. The corresponding western blot is also shown, with an exposure time of 5 minutes. The MMP-1 band size is 54kD. (b) Bowes cells were treated with DMSO, 5nM MMP-1 or 5nM MMP-1+50nM SCH79797. After 24hr, MMP-1 expression was measured by realtime-RT PCR. Data were normalized to GAPDH expression and analyzed using the 2(-ΔΔCt) method. †p<0.001 compared to control, ††p<0.001 compared to 5nM MMP-1. Media were also collected and used for western blot to measure MMP-1 protein (30 sec exposure). (c) Bowes cells were treated with 5nM thrombin for 24hr in media containing 1% FBS. Media were collected and MMPs activated, then treated with 1μg/mL MMP-1 neutralizing antibody or anti-FLAG IgG control, as indicated. Media were added back to cells for an additional 48hr, for 72hr total treatment. MMP-1 expression was examined using realtime RT-PCR. #p=0.02 compared to control, ##p<0.001, and ###p=0.05, compared to treatment with thrombin for 24hr.

References

    1. Agarwal A, Covic L, Sevigny LM, Kaneider NC, Lazarides K, Azabdaftari G, et al. Targeting a metalloprotease-PAR1 signaling system with cell-penetrating pepducins inhibits angiogenesis, ascites, and progression of ovarian cancer. Mol Cancer Ther. 2008;7:2746–2757. - PMC - PubMed
    1. Airola K, Karonen T, Vaalamo M, Lehti K, Lohi J, Kariniemi AL, et al. Expression of collagenase-1 and -3 and their inhibitors TIMP-1 and -3 correlates with the level of invasion in malignant melanomas. Br J Cancer. 1999;80:733–743. - PMC - PubMed
    1. Arora P, Ricks TK, Trejo J. Protease-activated receptor signalling, endocytic sorting and dysregulation in cancer. J Cell Sci. 2007;120:921–928. - PubMed
    1. Balch C, Soong SJ, Atkins M, Buzaid A, Thompson J. An evidence-based staging system for cutaneous melanoma. CA Cancer J Clin. 2004;54:131–149. - PubMed
    1. Berwick M, Erdei E, Hay J. Melanoma Epidemiology and Public Health. Dermatologic Clinics. 2009;27:205–214. - PMC - PubMed

Publication types

MeSH terms