

Systems biology modeling of the radiation sensitivity network: a biomarker discovery platform
- PMID: 19735874
- PMCID: PMC2762403
- DOI: 10.1016/j.ijrobp.2009.05.056
Systems biology modeling of the radiation sensitivity network: a biomarker discovery platform
Abstract
Purpose: The discovery of effective biomarkers is a fundamental goal of molecular medicine. Developing a systems-biology understanding of radiosensitivity can enhance our ability of identifying radiation-specific biomarkers.
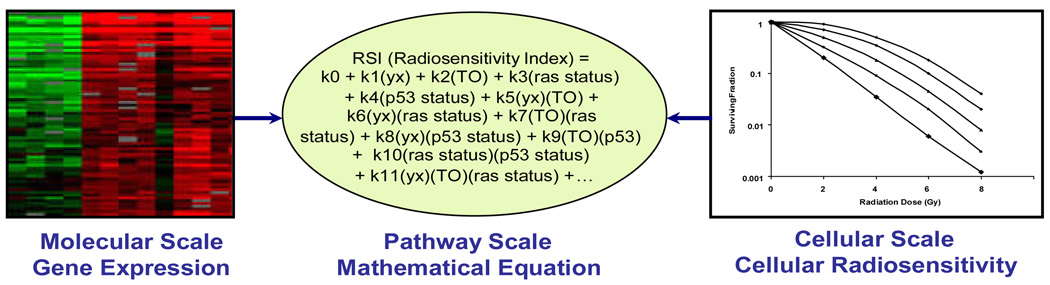
Methods and materials: Radiosensitivity, as represented by the survival fraction at 2 Gy was modeled in 48 human cancer cell lines. We applied a linear regression algorithm that integrates gene expression with biological variables, including ras status (mut/wt), tissue of origin and p53 status (mut/wt).
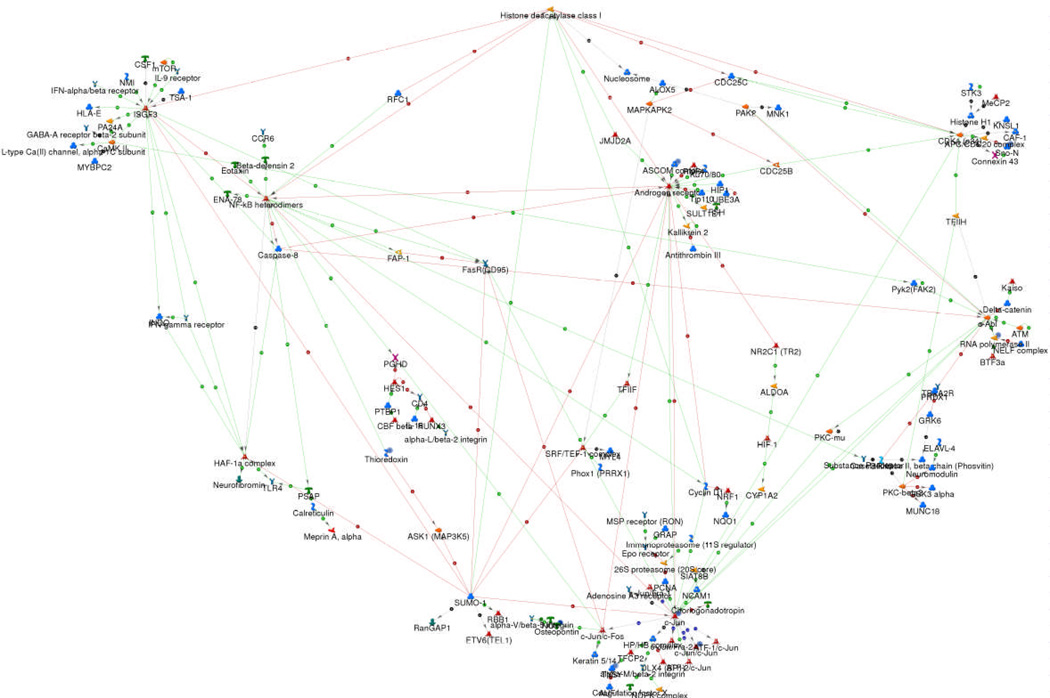
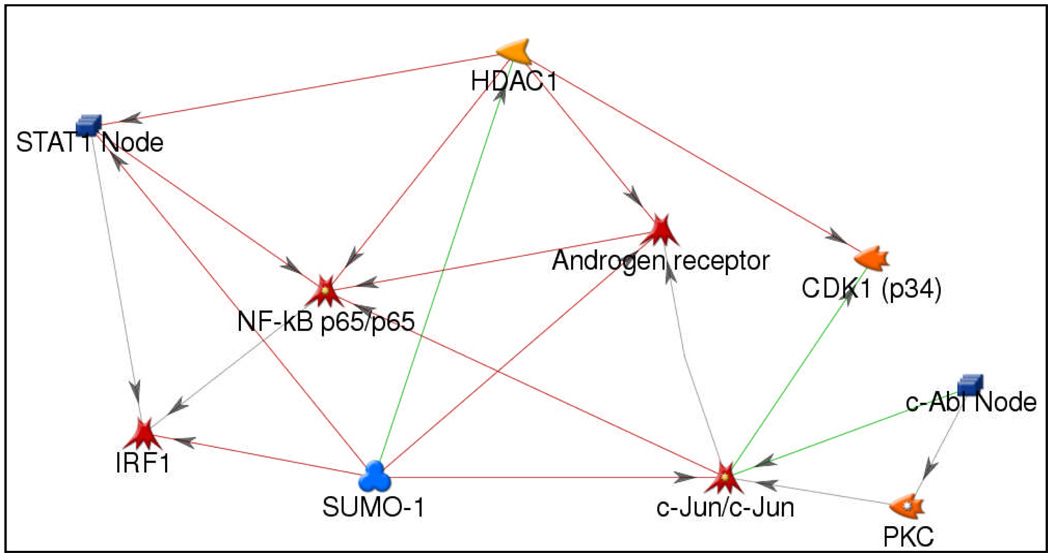
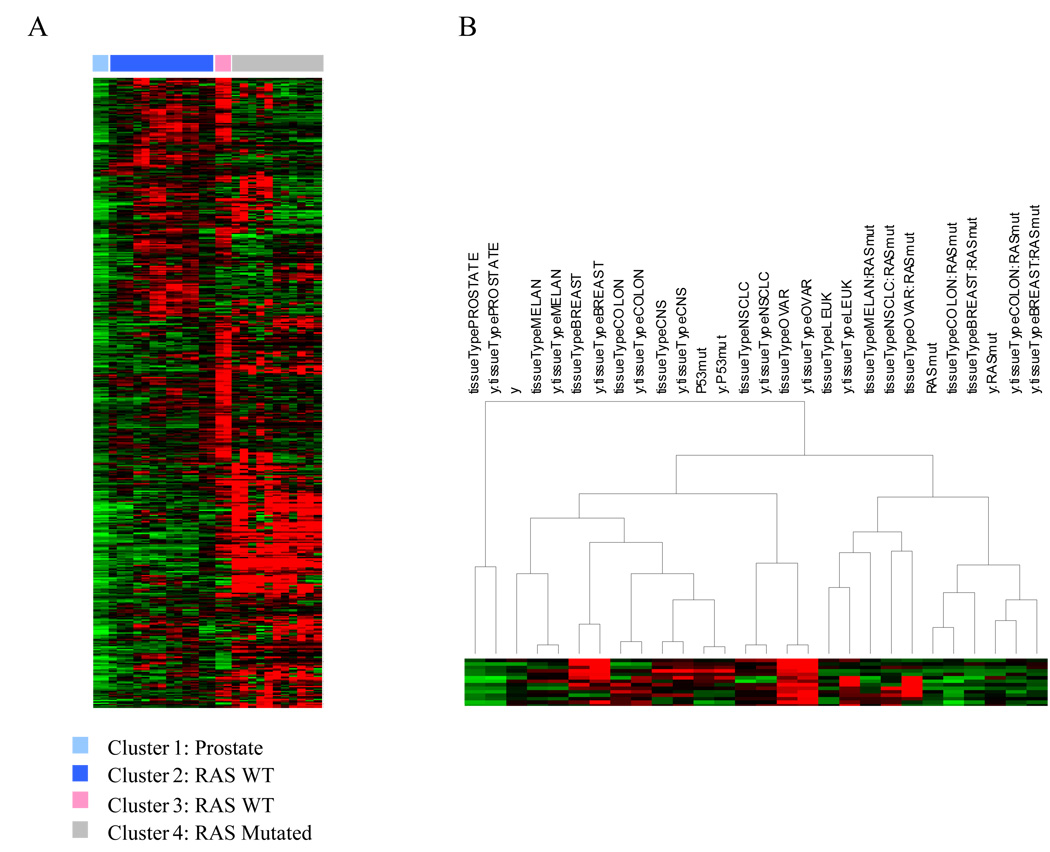
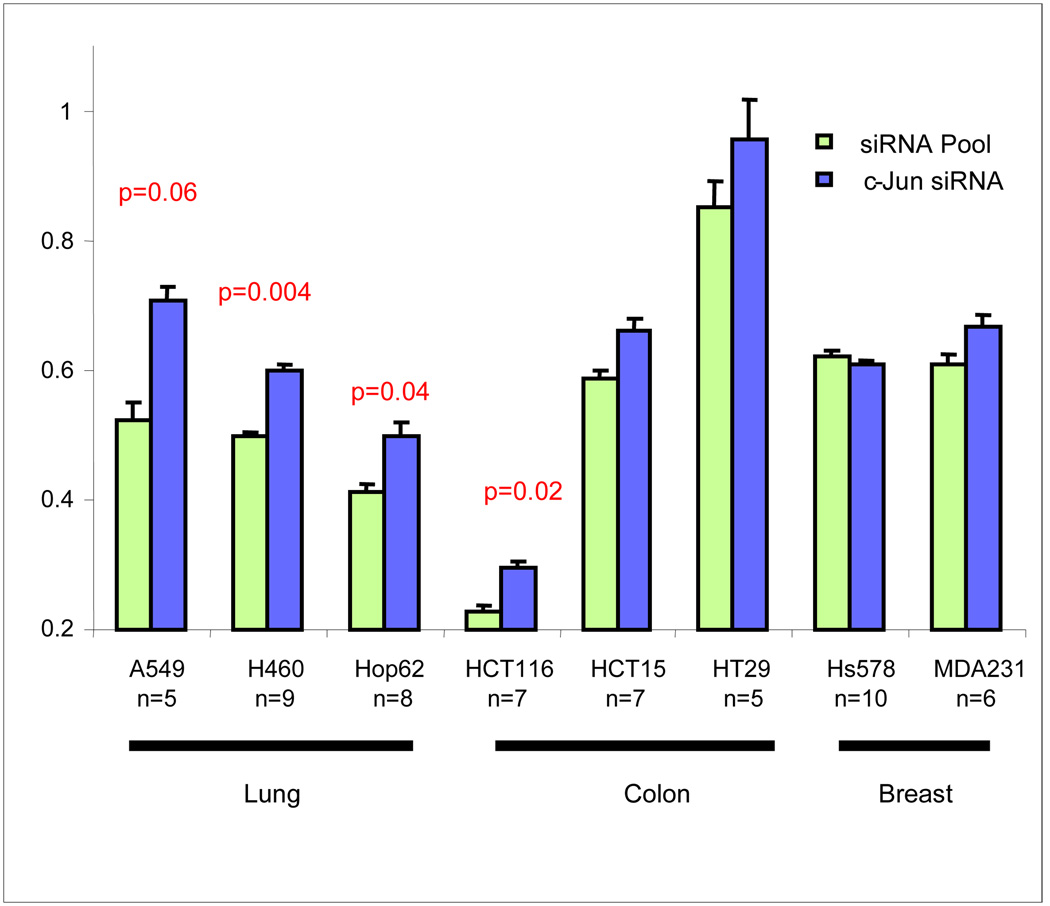
Results: The biomarker discovery platform is a network representation of the top 500 genes identified by linear regression analysis. This network was reduced to a 10-hub network that includes c-Jun, HDAC1, RELA (p65 subunit of NFKB), PKC-beta, SUMO-1, c-Abl, STAT1, AR, CDK1, and IRF1. Nine targets associated with radiosensitization drugs are linked to the network, demonstrating clinical relevance. Furthermore, the model identified four significant radiosensitivity clusters of terms and genes. Ras was a dominant variable in the analysis, as was the tissue of origin, and their interaction with gene expression but not p53. Overrepresented biological pathways differed between clusters but included DNA repair, cell cycle, apoptosis, and metabolism. The c-Jun network hub was validated using a knockdown approach in 8 human cell lines representing lung, colon, and breast cancers.
Conclusion: We have developed a novel radiation-biomarker discovery platform using a systems biology modeling approach. We believe this platform will play a central role in the integration of biology into clinical radiation oncology practice.
Conflict of interest statement
Conflict of Interest: SE and JTR are named as inventors in a patent application for the technology described.
Figures
References
-
- Dalton WS, Friend SH. Cancer biomarkers--an invitation to the table. Science. 2006;312:1165–1168. - PubMed
-
- van't Veer LJ, Dai H, van de Vijver MJ, et al. Gene expression profiling predicts clinical outcome of breast cancer. Nature. 2002;415:530–536. - PubMed
-
- Beer DG, Kardia SL, Huang CC, et al. Gene-expression profiles predict survival of patients with lung adenocarcinoma. Nat Med. 2002;8:816–824. - PubMed
-
- Chung CH, Parker JS, Karaca G, et al. Molecular classification of head and neck squamous cell carcinomas using patterns of gene expression. Cancer Cell. 2004;5:489–500. - PubMed
-
- Eschrich S, Yang I, Bloom G, et al. Molecular staging for survival prediction of colorectal cancer patients. J Clin Oncol. 2005;23:3526–3535. - PubMed
Publication types
MeSH terms
Substances
Grants and funding
LinkOut - more resources
Full Text Sources
Other Literature Sources
Research Materials
Miscellaneous
