. 2009 Nov 1;587(Pt 21):5081-93.
doi: 10.1113/jphysiol.2009.180091. Epub 2009 Sep 7.

Differential expression of membrane conductances underlies spontaneous event initiation by rostral midline neurons in the embryonic mouse hindbrain

Affiliations

Differential expression of membrane conductances underlies spontaneous event initiation by rostral midline neurons in the embryonic mouse hindbrain

Audrey M Moruzzi et al. J Physiol. .

Abstract

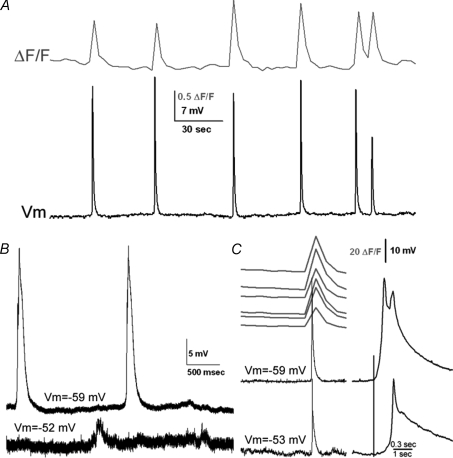
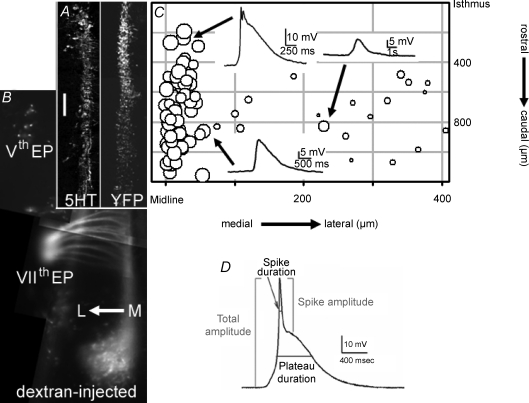
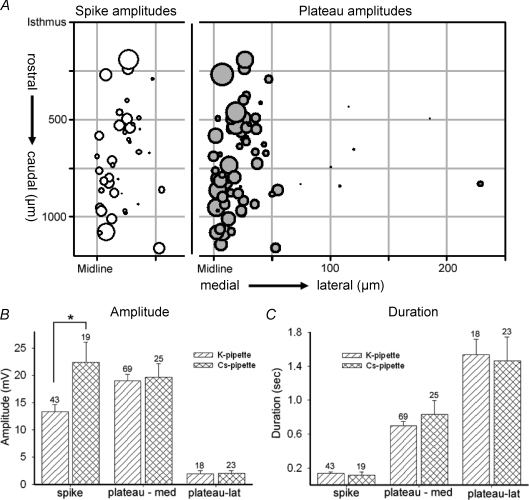
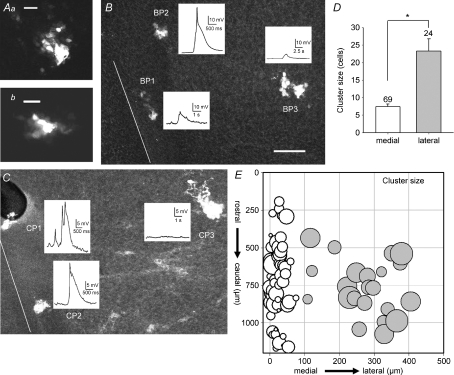
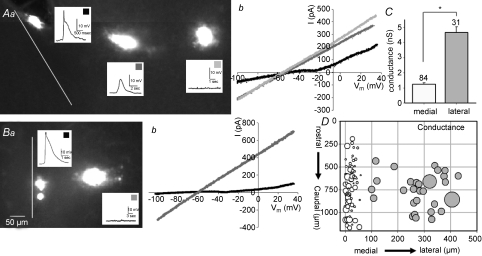
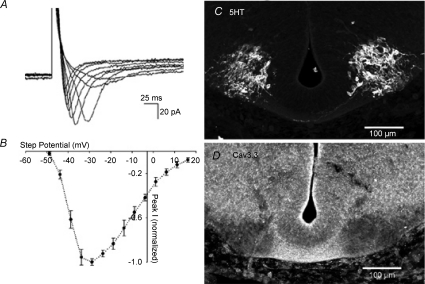
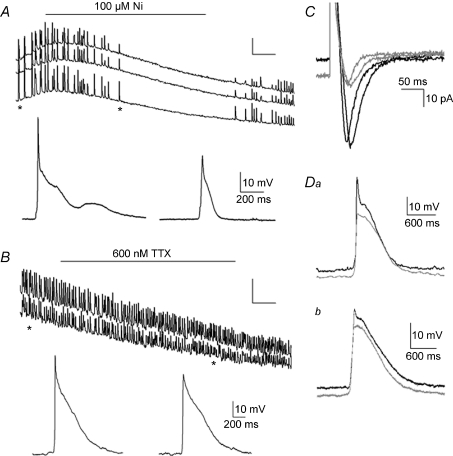
Spontaneous activity is expressed in many developing CNS structures and is crucial in correct network development. Previous work using [Ca(2+)](i) imaging showed that in the embryonic mouse hindbrain spontaneous activity is initiated by a driver population, the serotonergic neurons of the nascent raphe. Serotonergic neurons derived from former rhombomere 2 drive 90% of all hindbrain events at E11.5. We now demonstrate that the electrical correlate of individual events is a spontaneous depolarization, which originates at the rostral midline and drives events laterally. Midline events have both a rapid spike and a large plateau component, while events in lateral tissue comprise only a smaller amplitude plateau. Lateral cells have a large resting conductance and are highly coupled via neurobiotin-permeant gap junctions, while midline cells are significantly less gap junction-coupled and uniquely express a T-type Ca(2+) channel. We propose that the combination of low resting conductance and expression of T-type Ca(2+) current is permissive for midline neurons to acquire the initiator or driver phenotype, while cells without these features cannot drive activity. This demonstrates that expression of specific conductances contributes to the ability to drive spontaneous activity in a developing network.


Figures

Figure 1
Figure 1. Electrical events are correlated temporally with [Ca2+]i events
A, in simultaneous [Ca2+]i imaging and current clamp recording from neurons in the InZ, single [Ca2+]i events correlate with spikes in electrical events. Resting potential for this cell =−57 mV. B, dual recording from cells approximately 120 μm apart, medial to lateral; the estimated propagation rate of the event is 1066 μm s−1. C, simultaneous [Ca2+]i imaging of midline regions and dual patch recording; cell recorded in the bottom trace was approximately 50 μm caudal to the cell in the top trace. Expanded traces, on right, show details of the waveforms of the events. Potassium gluconate pipette solution.
Figure 2
Figure 2. Event properties and amplitudes vary with medio-lateral position
A, left panel: fixed hemi-hindbrain, sliced in the coronal plane to emulate the open-book preparation, showing extent of 5HT-positive neurons in the rostral serotonergic raphe group from the isthmus (midbrain-hindbrain junction) to the rostral border of former r4. Right panel: YFP-Pet1-labelled neurons in coronal hemi-hindbrain section, showing the rostral–caudal extent of the Pet-1-positive cells. Scale bar = 200 μm. B, dextran injection into branchial arches b1 and b2 demonstrates the Vth nerve (in the former r2) and the fan of the VIIth nerve (exit point is in former r4) in live hindbrain. Line of medial-lateral arrow is 200 μm. C, events are plotted as symbols against rostrocaudal and mediolateral position; symbol diameter represents the logarithm of the maximal total amplitude of each event. Insets show events from indicated sites (arrows). Events at the midline are larger and often have both a spike and a plateau. Potassium gluconate pipette solution. A, B and C are shown to the same vertical (rostrocaudal) scale, with the isthmus as the 0 μm point; horizontal (mediolateral) scale in C is expanded for clarity, with the midline as the 0 μm point. D, measurement of event parameters. Total amplitudes were measured from the baseline to the maximal spike excursion; spike amplitudes were measured from the top of the plateau to peak of total event; plateau amplitude was the difference between those values. Duration of each component was measured at the half-amplitude point.
Figure 3
Figure 3. Summary analysis of event parameters
A, double-plot of the isolated amplitudes of spike (left) or plateau (right) events, against position. The x-axis is replicated at left for the midline–100 μm range to plot only the spike components (open circles), found only within 100 μm of the midline; plateau components (grey circles) are plotted on the 0–250 μm range, as they are recorded medially and laterally in the hindbrain. Potassium gluconate pipette solution. B and C, distribution of different components of depolarizing events, comparing data derived from K+- and Cs+-filled pipettes. B, the amplitudes of plateau components were similar in both pipette solutions, with lateral plateaus being significantly smaller than those recorded from medial cells. The amplitude of the spike component, however, was significantly larger in recordings using Cs+-filled pipettes (asterisk; P < 0.0016). C, the duration of all components was the same when measured with K+- or Cs+-filled pipettes; medial plateau durations (middle columns) are significantly shorter than those recorded in lateral cells (right columns).
Figure 4
Figure 4. Cluster size, or number of neurobiotin-coupled neurons, is significantly larger in lateral positions
Aa and b, high power (400×) confocal images of clusters of neurobiotin-coupled neurons from medial positions. Scale bars are 10 μm. B and C, in each panel, low power (100×) confocal images of hindbrains with 3 recordings each are shown; neurons near the midline (white lines) have larger depolarizations and are coupled to fewer cells. Scale bar (30 μm) applies to both images. D, neurobiotin-coupled cluster size is significantly different between medial (white bar) and lateral (grey bar) positions. E, cluster size for each recorded neuron, counted in confocal images and plotted against position in the hindbrain, is shown on a logarithmic scale to facilitate better comparison. Each recording was held for 15 min, and the tissue fixed and reacted for neurobiotin. Potassium gluconate pipette solution.
Figure 5
Figure 5. Neurons within 100 μm of the midline have high input resistance
A and B, examples of hindbrains with multiple recordings showing ramp voltage-clamp responses compared between medial and lateral cells. Aa and Ba are low power (100×) confocal images showing cell position, depolarizing events and neurobiotin coupling; scale bar of 50 μm applies to both images. Ab and Bb show resultant currents from ramps applied in voltage clamp; more lateral cells (shade of line corresponds to squares on insets) have higher resting conductance, reflected as steeper slope. Medial neurons in A and B express inward deflection in the slope of the resultant current at about −30 mV. C, conductance of all cells grouped by position show that lateral cells (grey bar) have significantly higher resting conductance than medial cells (white bar). D, the conductance (symbol size represents conductance), subtracted by leak, for each cell is plotted against position in the hindbrain, showing that lateral neurons have significantly higher resting conductance than those in medial positions. Potassium gluconate pipette solution.
Figure 6
Figure 6. Characterization of T-type Ca2+ channels in medial hindbrain cells
A, inward currents recorded using Cs+-filled pipette in voltage clamp during steps to −50 to −10 mV in 5 mV increments; holding potential was −95 mV. B, current–voltage relation for inward currents averaged from eight neurons, showing peak of inward current at approximately −35 mV. C, control panel shows transverse section of hindbrain using an antibody directed against 5HT. D, similar section in sibling E11.5 embryo, using an antibody against the Cav3.3 protein, showing strong staining in the region of 5HT-positive cell bodies and in the commissural region of crossing axons. CsMeSO4 pipette solution.
Figure 7
Figure 7. Blockers of ICa-T abolish SA and the spike component of depolarizing events in medial hindbrain cells
A, simultaneous [Ca2+]i imaging (top) and patch clamp of a medial neuron during application of 100 μm Ni2+, which blocks SA. Asterisks show the time points where the expanded current clamp recordings of individual events are taken, which demonstrate that Ni2+ blocks the peak component of depolarizing events. B, simultaneous [Ca2+]i (top) and patch recording during application of 600 nm TTX, which does not block SA in E11.5 midline neurons. Asterisks show the times at which individual expanded depolarizing events were recorded, showing that although the peak of the events decreases over time, it is not blocked by TTX. C, application of 50 μm Ni2+ during voltage clamp recoding of ICa-T demonstrates reduction of that current (grey traces) by Ni2+. Da and b, superposition of control (black) and Ni2+-blocked (grey) depolarizing events in a medial (Da; 40 μm from midline) and more lateral (Db; 75 μm from midline) neuron demonstrate that application of 100 μm Ni2+ blocks the peak component of depolarizing events, but does not affect the plateau component. Events with Ni2+ are plotted slightly below the control traces for clarity; the resting potential did not change during the recordings. Potassium gluconate pipette solution (A,B,D); CsMeSO4 pipette solution (C).

Comment in

References

    1. Aghajanian GK, Vandermaelen CP. Intracellular recordings from serotonergic dorsal raphe neurons: pacemaker potentials and the effect of LSD. Brain Res. 1982;238:463–469. - PubMed
    1. Allene C, Cattani A, Ackman JB, Bonifazi P, Aniksztejn L, Ben-Ari Y, Cossart R. Sequential generation of two distinct synapse-driven network patterns in developing neocortex. J Neurosci. 2008;28:12851–12863. - PMC - PubMed
    1. Bayliss DA, Li YW, Talley EM. Effects of serotonin on caudal raphe neurons: activation of an inwardly rectifying potassium conductance. J Neurophysiol. 1997a;77:1349–1361. - PubMed
    1. Bayliss DA, Li YW, Talley EM. Effects of serotonin on caudel raphe neurons: inhibition of N- and P/Q-type calcium channels and the afterhyperpolarization. J Neurophysiol. 1997b;77:1362–1374. - PubMed
    1. Ben-Ari Y. Developing networks play a similar melody. Trends Neurosci. 2001;24:353–360. - PubMed

Publication types

LinkOut - more resources