. 2009 Oct 15;587(Pt 20):4873-86.
doi: 10.1113/jphysiol.2009.172544. Epub 2009 Sep 7.

Myostatin represses physiological hypertrophy of the heart and excitation-contraction coupling

Affiliations

Myostatin represses physiological hypertrophy of the heart and excitation-contraction coupling

Buel D Rodgers et al. J Physiol. .

Abstract

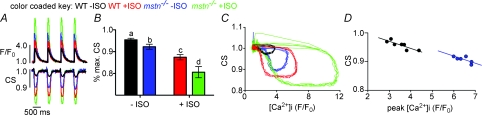
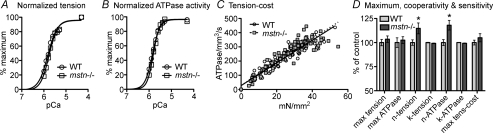
Although myostatin negatively regulates skeletal muscle growth, its function in heart is virtually unknown. Herein we demonstrate that it inhibits basal and IGF-stimulated proliferation and differentiation and also modulates cardiac excitation-contraction (EC) coupling. Loss of myostatin induced eccentric hypertrophy and enhanced cardiac responsiveness to beta-adrenergic stimulation in vivo. This was due to myostatin null ventricular myocytes having larger [Ca(2+)](i) transients and contractions and responding more strongly to beta-adrenergic stimulation than wild-type cells. Enhanced cardiac output and beta-adrenergic responsiveness of myostatin null mice was therefore due to increased SR Ca(2+) release during EC coupling and to physiological hypertrophy, but not to enhanced myofilament function as determined by simultaneous measurement of force and ATPase activity. Our studies support the novel concept that myostatin is a repressor of physiological cardiac muscle growth and function. Thus, the controlled inhibition of myostatin action could potentially help repair damaged cardiac muscle by inducing physiological hypertrophy.


Figures

Figure 1
Figure 1
Qualitative expression of myostatin, its binding proteins and its receptors during differentiation Equilibrative nucleoside transporter (ENT)-1 and myogenic factor (Myf)-5 were used as differentiation markers and β-actin as a loading control. Transcripts for myostatin (MSTN), follistatin (FS), follistatin-like (FSTL)-3, growth and differentiation factor associated protein (GASP)-1, activin type II receptors (Acvr2 and Acvr2b), activin like kinase (ALK4 and ALK5) and BMP and activin membrane-bound inhibitor (BAMBI) were amplified using qualitative RT-PCR. (B, myoblasts; 3D and 6D, days in differentiation medium; H, adult rat heart; M, adult rat skeletal muscle (gastrocnemius); H9C2, cardiomyoblasts; L6, skeletal myoblasts.) Samples were amplified for different numbers of cycles (right) to assure that comparisons are made within the linear phase of the amplification curve.
Figure 2
Figure 2
Myostatin inhibits IGF-stimulated and basal cardiomyoblast proliferation and differentiation A, H9C2 cells were cultured with IGF-I 48 h in the absence or presence of 10% serum (FBS). Results from multiple experiments were pooled by expressing data as a percentage of controls for each time point. B, H9C2 cells were cultured in serum-free medium in the presence or absence of a range of myostatin (MSTN) concentrations. Cells were grown for 48 h before the total cell number was measured. Results from multiple experiments were pooled and data are expressed as a percentage of controls. C, H9C2 cells were cultured for 48 h with the indicated combinations and concentrations (nm) of myostatin, IGF-I or LR3 in serum free medium. D, H9C2 cells were cultured in the presence or absence of 11 nm MSTN and stimulated to differentiate in 1% FBS and 10 nm retinoic acid added daily. Equilibrative nucleoside transporter (ENT)-1 was used as a differentiation marker and was quantified using ‘real-time’ RT-PCR. (Myo, proliferating myoblasts; 3D/6D, days in differentiation medium; +, differentiation medium with 11 nm myostatin). Significant differences (P≤ 0.05) in each panel are indicated by different letters (comparisons within −/+ serum groups, not between groups in panel A) whereas groups sharing the same letters are not different.
Figure 3
Figure 3
Enhanced resting and stress-induced cardiac performance in myostatin null mice A, echocardiography was performed on the LV parasternal long axis, left parasternal short axis and subcostal long axis views. Data are presented as percentage difference from wild-type (WT) values represented by the horizontal dashed line (LVIDd, left ventricle internal diameter (end diastole, mm); LVIDs, LVID systole; IVSd, intraventricular septum (dimension end diastole, mm); LVWd, LV wall dimension (systole, mm); Diast vol, LV end diastolic volume (ml); Syst vol, LV end systolic volume (ml); FS, % fractional shortening; EF, % ejection fraction; LV IVRT, LV isovolumic relaxation time (ms); Ao velo, max aortic ejection velocity (cm s−1); VTI, velocity time intergral (cm); acel, ejection acceleration time (ms); ET, ejection time (ms); ac/ET, ratio of acel to ET; MV E, max LV early filling velocity (cm s−1); A, max LV late filling (atrial contraction) velocity (cm s−1); E/A, ratio of E to A velocities; DT, deceleration time of early LV filling (ms); LV mass, left ventricle mass (g); HR, heart rate (b m−1).) Structure, contractility and haemodynamic parameters are grouped and are indicated by differential shading. B, mice were injected intraperitoneally with 10 mg kg−1 ISO. Data are represented as percentage change from resting values (before ISO treatment). In both A and B, asterisks denote significant differences (P≤ 0.05, n= 6/group).
Figure 4
Figure 4
Myostatin decreases excitation–contraction coupling in ventricular myocytes A, confocal line-scan images of evoked [Ca2+]i transients (1 Hz) in WT and mstn−/− ventricular myocytes before and after the application of 100 nm ISO. B, the traces represent the spatially averaged time course of [Ca2+]i in each of the images above. C, bar plots of [Ca2+]i transient amplitudes before and after ISO (left) and percentage increase in [Ca2+]i in response to ISO (right) in WT and mstn−/− myocytes. D, caffeine-induced [Ca2+]i transients in typical WT and mstn−/− myocytes. The arrow marks the time when caffeine (20 mm) was applied. The bar plot shows the mean ±s.e.m. of the amplitude of the caffeine-induced [Ca2+]i transients in WT and mstn−/− myocytes. Significant differences (P≤ 0.05) in all panels are indicated by different letters or an asterisk, whereas groups sharing the same letters are not different.
Figure 5
Figure 5
Myostatin decreases excitation–contraction coupling in ventricular myocytes A, time course of [Ca2+]i (top) and cell shortening (CS) in representative WT and mstn−/− ventricular myocytes before and after the application of 100 nm ISO. [Ca2+]i transients were evoked via field stimulation (1 Hz). B, bar plot of the peak CS in WT and mstn−/− cells before and after ISO. Smaller values represent greater contractions and thus shorter cell lengths. Significant differences (P≤ 0.05) are indicated by different letters, whereas groups sharing the same letters are not different. C, relationship between [Ca2+]i and CS, during four consecutive contractions, in WT and mstn−/− myocytes before and after ISO. Data are plotted as a trajectory. D, relationship between CS and [Ca2+]i at peak [Ca2+]i for ventricular myocytes taken from WT and mstn−/− animals. Data points were chosen to reflect the relationships shown in panel C as they arise vertically for a number of points at the maximal [Ca2+]i.
Figure 6
Figure 6
Biophysical assessment of skinned cardiac muscle from wild-type (WT) and myostatin null (mstn−/−) mice Resting sarcomere length was adjusted to 2.2 μm. A, normalized pCa–tension relation of skinned fibres from WT (pCa50= 5.79 ± 0.02, n= 1.86 ± 0.05) and mstn−/− (pCa50= 5.74 ± 0.02, n= 2.13 ± 0.11) hearts. B, normalized pCa–ATPase relation of fibres from WT (pCa50= 5.84 ± 0.01, n= 2.44 ± 0.11) and mstn−/− (pCa50= 5.80 ± 0.02, n= 2.98 ± 0.13) hearts. C, slopes of the tension–ATPase relations for WT and mstn−/− fibres (8.11 ± 0.2 and 8.51 ± 0.34 pmol mN−1 mm−1 s−1, respectively). D, differences in the maximum (max), cooperativity (n) and sensitivity (k, pCa50) values for tension, ATPase activity and tension-cost. Values are presented as means ±s.e.m. (n= 10, P≤ 0.05).

Comment in

References

    1. Abergel E, Chatellier G, Hagege AA, Oblak A, Linhart A, Ducardonnet A, Menard J. Serial left ventricular adaptations in world-class professional cyclists: implications for disease screening and follow-up. J Am Coll Cardiol. 2004;44:144–149. - PubMed
    1. Adams GR. Invited Review: Autocrine/paracrine IGF-I and skeletal muscle adaptation. J Appl Physiol. 2002;93:1159–1167. - PubMed
    1. Artaza JN, Reisz-Porszasz S, Dow JS, Kloner RA, Tsao J, Bhasin S, Gonzalez-Cadavid NF. Alterations in myostatin expression are associated with changes in cardiac left ventricular mass but not ejection fraction in the mouse. J Endocrinol. 2007;194:63–76. - PubMed
    1. Catalucci D, Latronico MV, Ellingsen O, Condorelli G. Physiological myocardial hypertrophy: how and why? Front Biosci. 2008;13:312–324. - PubMed
    1. Chandra M, Rundell VL, Tardiff JC, Leinwand LA, De Tombe PP, Solaro RJ. Ca2+ activation of myofilaments from transgenic mouse hearts expressing R92Q mutant cardiac troponin T. Am J Physiol Heart Circ Physiol. 2001;280:H705–713. - PubMed

Publication types

MeSH terms