. 2009 Sep 4;138(5):961-75.
doi: 10.1016/j.cell.2009.06.046.

The protein kinase IKKepsilon regulates energy balance in obese mice

Affiliations

The protein kinase IKKepsilon regulates energy balance in obese mice

Shian-Huey Chiang et al. Cell. .

Abstract

Obesity is associated with chronic low-grade inflammation that negatively impacts insulin sensitivity. Here, we show that high-fat diet can increase NF-kappaB activation in mice, which leads to a sustained elevation in level of IkappaB kinase epsilon (IKKepsilon) in liver, adipocytes, and adipose tissue macrophages. IKKepsilon knockout mice are protected from high-fat diet-induced obesity, chronic inflammation in liver and fat, hepatic steatosis, and whole-body insulin resistance. These mice show increased energy expenditure and thermogenesis via enhanced expression of the uncoupling protein UCP1. They maintain insulin sensitivity in liver and fat, without activation of the proinflammatory JNK pathway. Gene expression analyses indicate that IKKepsilon knockout reduces expression of inflammatory cytokines, and changes expression of certain regulatory proteins and enzymes involved in glucose and lipid metabolism. Thus, IKKepsilon may represent an attractive therapeutic target for obesity, insulin resistance, diabetes, and other complications associated with these disorders.


Figures
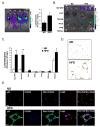
Figure 1
Figure 1. HFD increases NFκB activity in adipose tissue measured by in vivo bioluminescence in live mice
A. Male HLL mice on normal diet (ND) and HFD were assessed for bioluminescence after injection of luciferin. Luminescence was collected from a gate limited to the abdominal cavity is presented for ND and HFD HLL mice. (n=7 per group). *p-value<0.05. B. Tissues from HLL mice were dissected and assessed ex vivo for luminescence. Epididymal white adipose tissue (Epi WAT). C. Quantitation of absolute tissue luminescence from HLL mice. n=7 per group. Data was collected serially after dissection to ensure plateau of luminescent signal. D. Immunohistochemical localization of luciferase expression in epididymal fat pads from HLL mouse fed with normal and high-fat diet. E. Epididymal fat pads from ND or HFD fed male mice were analyzed for p65/RelA expression by immunofluorescence showing maximal signal concentration of p65/RelA in ATM clusters and localization of p65 in ATM nuclei (TOPRO3 as nuclear marker). Bar=20μm.
Figure 2
Figure 2. HFD increases IKK ε expression in white adipose tissue and liver
A. qPCR analysis on the expression of genes encoding IKK family members in liver and white adipose tissue. White bars, wild-type mice, normal diet (ND) (n=6); gray bar, wild-type mice, high fat diet (HFD) for 4 months (n=6). All data are presented as the average ±SEM normalized to Rplp0 expression. Average of ND value was set as 1. B. qPCR analysis on the expression of genes encoding IKK family members in isolated adipocytes and stromal vascular fraction. White bars, ND (n=6); gray bar, HFD for 4 months (n=6). C. (Top) confocal merged images from epididymal fat pads from ND and HFD-fed mice co-stained with anti-IKKε (green), anti-MGL1 (red) and anti-Caveolin1 (blue) antibodies. Representative image shown and similar results from 3–4 independent mice. (Bottom) confocal images from epididymal fat pads from HFD-fed wild-type mice immunostained with anti-IKKε antibody (green), anti-F4/80 antibody (red) or merged image with anti-caveolin 1 antibody (blue).(Bar =50μm) D. Lysates from liver and white adipose tissue (WAT) of wild type (WT) and IKKε knockout mice (IKKε KO) fed with ND or HFD were immunoprecipitated with antibody against IKKε as indicated. The expression level of IKKε was determined by immunoblotting with same antibody against IKKε. E. Lysates from liver and WAT of WT and IKKε KO fed with ND or HFD were immunoprecipitated (IP) with antibody against IKKε and assayed for kinase activity against myelin basic protein (MBP) as substrate. The expression level of IKKε in IP was determined by immunoblotting with same antibody against IKKε. Lysates for IP were immunoblotted with antibodies against Rab5B and Caveolin 1 as a loading control.
Figure 3
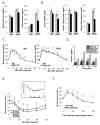
Figure 3. IKKε KO mice are protected from diet-induced weight gain by increasing energy expenditure
(A) Representative images of mice from WT and IKKε KO mice fed with ND or HFD. (B) Representative confocal image of caveolin-stained epididymal adipose tissue from WT and KO mice fed with HFD. Bar=100μm. (C) Whisker plot of adipocyte area from evaluation of <500 adipocytes from 3–4 independent mice. *p<0.0001 comparing mean adipocyte area. (D) Adipocyte numbers in fat pads of WT (gray bar) and IKKε KO mice (black bar) fed with HFD. n=5 mice per genotype. *, p-value<0.005. (E) Food intake was measured for WT (gray bar) and KO (black bar) mice fed with ND or HFD as indicated. n=8 mice per group. *, p-value<0.05. (F) Oxygen consumption (VO2) was measured for WT (orange) and KO (green) mice fed with ND (top) or WT (red) and KO (blue) mice fed with HFD (bottom) for three days as indicated. n=8 mice per group. (G) Respiratory quotient (RQ) was measured for WT (orange) and KO (green) mice fed with ND (top) or WT (red) and KO (blue) mice fed with HFD (bottom) for three days as indicated. n=8 mice per group. (H) (Top) qPCR analysis on the expression of genes encoding UCP-1 in WAT. Gray bars, wild-type mice (n=6); black bar, IKKε KO mice (n=6) fed with ND or HFD as indicated. All data are presented as the average ±SEM normalized to Rplp0 expression. *, p-value<0.05. Average of WT fed with ND value was set as 1. (Bottom) Protein expression of UCP-1 in WAT, measured by immunoblotting with WAT lysates from WT and IKKε KO mice (5 mice in each group) fed with HFD as indicated. Rab5 was used as internal loading control. (I) Rectal temperature measured for WT and KO mice fed with ND (3 months old) or HFD (5 months old with diet for 2 months). n=10 per group. *, p-value<0.05; **, p-value<0.01.
Figure 4
Figure 4. IKKε KO mice display improved glucose and lipid homeostasis
(A)Blood glucose and serum insulin levels measured for 18 hr fasting WT (gray bar) and KO (black bar) mice fed with ND or HFD as indicated. n=12 mice per group. (B) Serum NEFA, triglyceride and total cholesterol levels measured for 18 hr-fasting WT (gray bar) and KO (black bar) mice fed with ND or HFD as indicated. n=12 mice per group. (C) Glucose tolerance test (GTT) measured for 12 hr-fasting WT (gray) and KO (black) mice fed with ND (left panel) or HFD (right panel). n=12 mice per group. (D)Serum insulin levels measured for mice during GTT shown in (C) at time points 0, 30, 60 and 180min after injection. (E) Insulin tolerance test (ITT) measured for 3 hr fasting WT (gray) and KO (black) mice fed with ND or HFD. n=12 mice per group. (F) Pyruvate tolerance test (PTT) measured for 12 hr fasting WT (gray) and KO (black) mice fed with HFD. n=12 mice per group. All data are presented as the average ±SEM. (**, p-value<0.01).
Figure 5
Figure 5. IKKε KO preserves insulin signaling and insulin sensitivity in liver and adipose cells in mice on HFD
(A–C) Mice fasted for 18 hrs were IP injected with insulin (5mU/g) or saline. Lysates from liver (A), WAT (B) and gastrocnemius (C) of WT (duplicate per group) or IKKε KO mice (triplicate per group) fed with HFD were immunoblotted with indicated antibodies. (D–E) qPCR analysis on the expression of genes encoding PDK4 (D) and glucokinase (E) in liver of WT and IKKε KO mice fed with ND or HFD as indicated. Gray bars, wild-type mice (n=6); black bar, IKKε KO mice (n=6). (F– G) qPCR analysis on the expression of genes encoding adiponectin (F) and PPARγ (G, Top) in WAT of WT and IKKε KO mice fed with ND or HFD as indicated. Gray bars, wild-type mice (n=6); black bar, IKKε KO mice (n=6). (G, Bottom) protein expression of PPARγ in WAT, measured by immunoblotting with WAT lysates from WT and IKKε KO mice (5 mice in each group) fed with HFD as indicated. Rab5 was used as internal loading control. (H) (Left) qPCR analysis on the expression of genes encoding the PPARγ targets CD36, CAP, GLUT4 in WAT of WT and IKKε KO mice fed with ND or HFD as indicated. Gray bars, wild-type mice (n=6); black bar, IKKε KO mice (n=6). (Right) protein expression of CD36, CAP and GLUT4 in WAT, measured by immunoblotting with WAT lysates from WT (duplicate mice in each group) and IKKε KO mice (triplicate mice in each group) fed with ND or HFD as indicated. Rab5 was used as internal loading control. (I) Ex vivo insulin-stimulated glucose incorporation into lipid in adipocytes isolated from WT and KO mice fed with ND or HFD as indicated. Cells were untreated (white bar) or treated with insulin for 60min (shaded bar). n=3 mice per condition. (**, p-value<0.01). (J) Insulin-stimulated glucose uptake in 3T3-L1 adipocytes. Differentiated adipocytes were electroporated with vector control (white bar), IKKε WT (gray bar) or IKKε kinase dead (K38A) (black bar) mutant expression constructs. Cells were untreated (basal) or treated with insulin for 30min (Insulin). 14C-2DG uptake in cells was normalized with total amount of protein. n=3 for each condition. All data are presented as the average ±SEM.
Figure 6
Figure 6. IKKε KO mice are protected from diet-induced hepatic steatosis
(A) Liver weight normalized with body weight was measured from WT (gray bar) and IKKε KO (black bar) mice fed with ND or HFD as indicated. n=8 for each group. (*, p-value<0.05). (B) Representative images of liver from WT and KO mice fed with ND or HFD as indicated. (C) Liver triglyceride content normalized with liver weight was measured from WT (gray bar) and IKKε KO (black bar) mice fed with ND or HFD in fed or fasted condition as indicated. n=8 for each group (*, p-value<0.05; **, p-value<0.01). (D)Representative images of hematoxylin and eosin-stained section of liver from fasting WT or KO mice fed with HFD for 2 months. Arrows indicate central veins. (E) (Top) qPCR analysis on the expression of the gene encoding Lipin1 in liver of WT and IKKε KO mice fed with ND or HFD as indicated. Gray bars, wild-type mice (n=6); black bar, IKKε KO mice (n=6). (*, p-value<0.05). (Bottom) protein expression of lipin1 in liver, measured by immunoblotting with liver lysates from WT (duplicate mice in each group) and IKKε KO mice (triplicate mice in each group) fed with ND or HFD as indicated. Rab5 was used as an internal loading control. (F) qPCR analysis on the expression of genes encoding CD36, FABP4, PPARγ in liver of WT and IKKε KO mice fed with ND or HFD as indicated. Gray bars, wild-type mice (n=6); black bar, IKKε KO mice (n=6). (*, p-value<0.05; **, p-value<0.01). (G)(Top) Immunoblotting with an anti-FLAG antibody in H2.35 hepatoma cells. (Bottom) qPCR analysis on the expression of the indicated genes. Gene expression was measured from cells transfected with vector control (white bar), IKKε WT (gray bar) or IKKε kinase dead (K38A) (black bar) mutant expression constructs. (*, p-value<0.05; **, p-value<0.01).
Figure 7
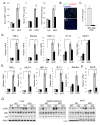
Figure 7. Obesity-induced inflammation is attenuated in IKKε KO mice
(A) Serum proinflammatory cytokines MCP-1, TNFα and Rantes secretion were measured in WT (gray bar) and IKKε KO mice (black bar) fed with ND or HFD as indicated. n=8. (**, p-value <0.01) (B) Representative images from epididymal fat pads of WT and KO mice fed with HFD co-stained with F4/80 (green), Isolectin (red) and caveolin 1 (blue). (C) Quantitation of F4/80+ crown-like structures. Confocal images were used to quantitate the percentage of crown-like structures. 3–5 low power fields analyzed for 3–4 mice per genotype (>1000 adipocyte examined per genotype, *p value<0.001). (D) qPCR analysis on the expression of genes encoding TNFα, Rantes, MIP-1α, IP-10 and MCP-1 in WAT of WT and IKKε KO mice fed with ND or HFD as indicated. Gray bars, wild-type mice (n=6); black bar, IKKε KO mice (n=6). (*, p-value<0.05; **, p-value<0.01). (E) qPCR analysis on the expression of genes encoding TNFα, MCP-1, MIP-1α, IP-10 and Rantes in liver of WT and IKKε KO mice fed with ND or HFD as indicated. Gray bars, wild-type mice (n=6); black bar, IKKε KO mice (n=6). (*, p-value<0.05; **, p-value<0.01). (F) qPCR analysis on the expression of gene encoding iNOS in liver of WT and IKKε KO mice fed with ND or HFD as indicated. Gray bars, wild-type mice (n=6); black bar, IKKε KO mice (n=6). (**, p-value<0.01). (G) Protein level of phospho-JNK, JNK, IκB were measured by immunoblotting with lysates from liver, gastrocnemius and WAT of WT (duplicate mice in each group) and IKKε KO mice (triplicate mice in each group) fed with ND or HFD as indicated. Rab5 and caveolin 1 were used as internal loading controls. All data are presented as the average ±SEM.

Comment in

References

    1. Arkan MC, Hevener AL, Greten FR, Maeda S, Li ZW, Long JM, Wynshaw-Boris A, Poli G, Olefsky J, Karin M. IKK-beta links inflammation to obesity-induced insulin resistance. Nat Med. 2005;11:191–198. - PubMed
    1. Armoni M, Harel C, Karni S, Chen H, Bar-Yoseph F, Ver MR, Quon MJ, Karnieli E. FOXO1 represses peroxisome proliferator-activated receptor-gamma1 and -gamma2 gene promoters in primary adipocytes. A novel paradigm to increase insulin sensitivity. J Biol Chem. 2006;281:19881–19891. - PubMed
    1. Bradbury MW. Lipid metabolism and liver inflammation. I. Hepatic fatty acid uptake: possible role in steatosis. Am J Physiol Gastrointest Liver Physiol. 2006;290:G194–198. - PubMed
    1. Cai D, Yuan M, Frantz DF, Melendez PA, Hansen L, Lee J, Shoelson SE. Local and systemic insulin resistance resulting from hepatic activation of IKK-beta and NF-kappaB. Nat Med. 2005;11:183–190. - PMC - PubMed
    1. Chen Z, Gropler MC, Norris J, Lawrence JC, Jr, Harris TE, Finck BN. Alterations in hepatic metabolism in fld mice reveal a role for lipin 1 in regulating VLDL-triacylglyceride secretion. Arterioscler Thromb Vasc Biol. 2008;28:1738–1744. - PMC - PubMed

Publication types