. 2009 Sep 4;138(5):976-89.
doi: 10.1016/j.cell.2009.06.051.

A serotonin-dependent mechanism explains the leptin regulation of bone mass, appetite, and energy expenditure

Affiliations

A serotonin-dependent mechanism explains the leptin regulation of bone mass, appetite, and energy expenditure

Vijay K Yadav et al. Cell. .

Abstract

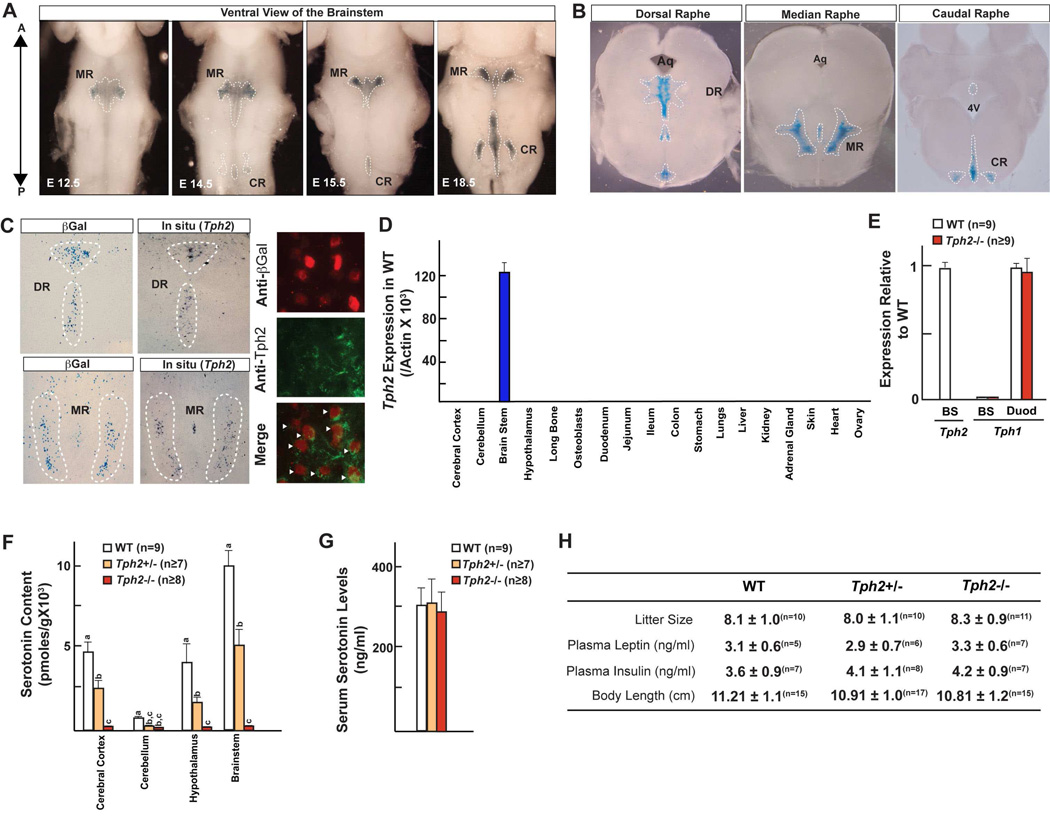
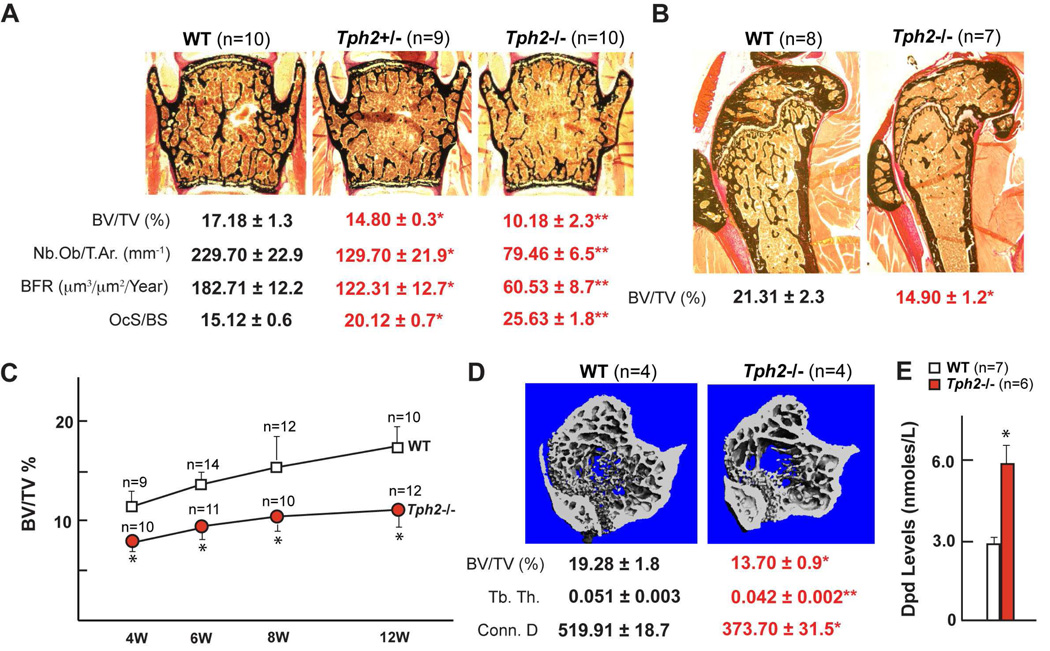
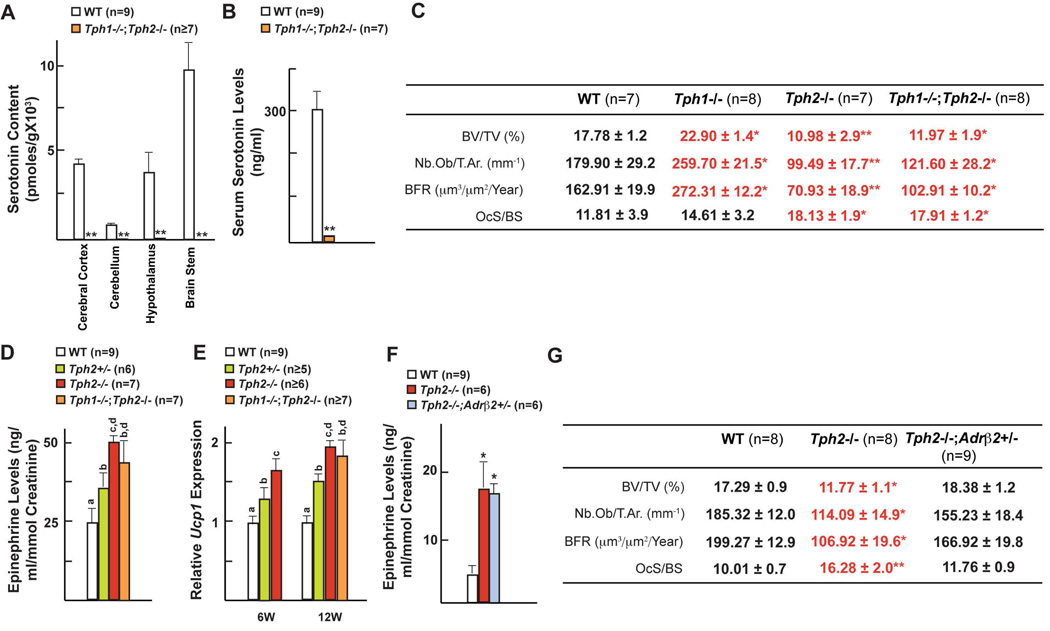
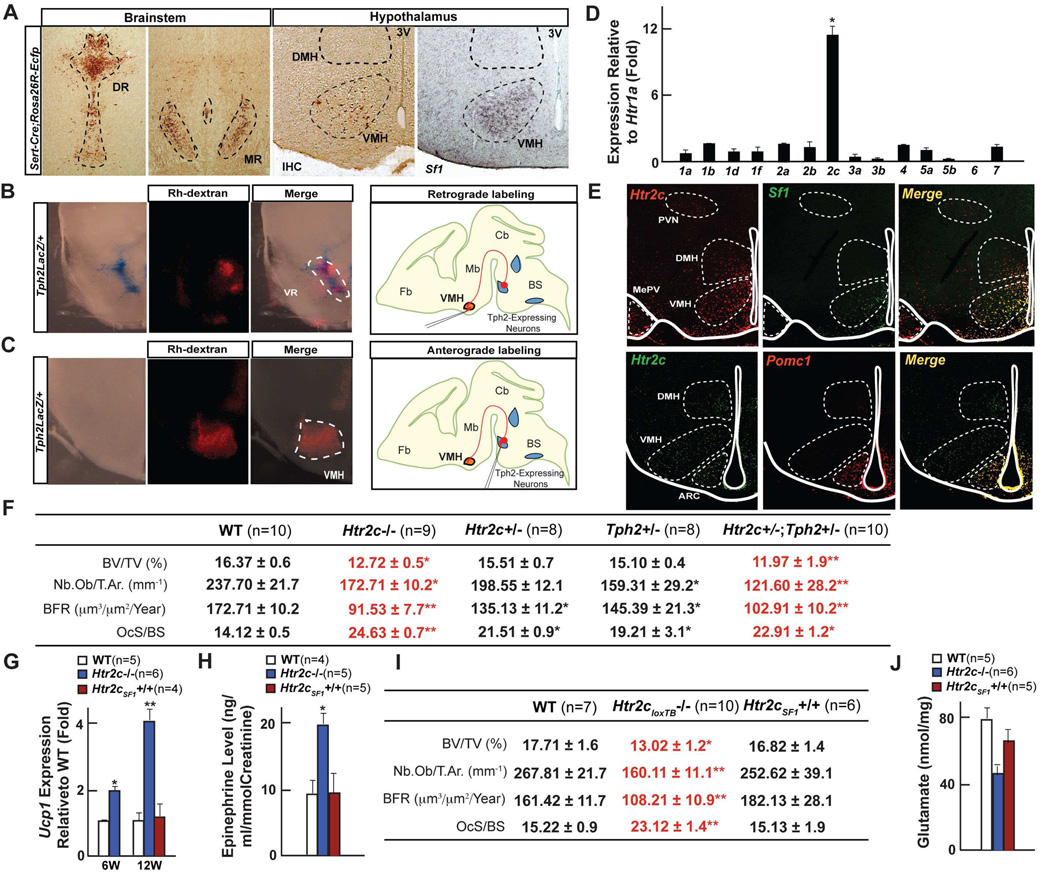
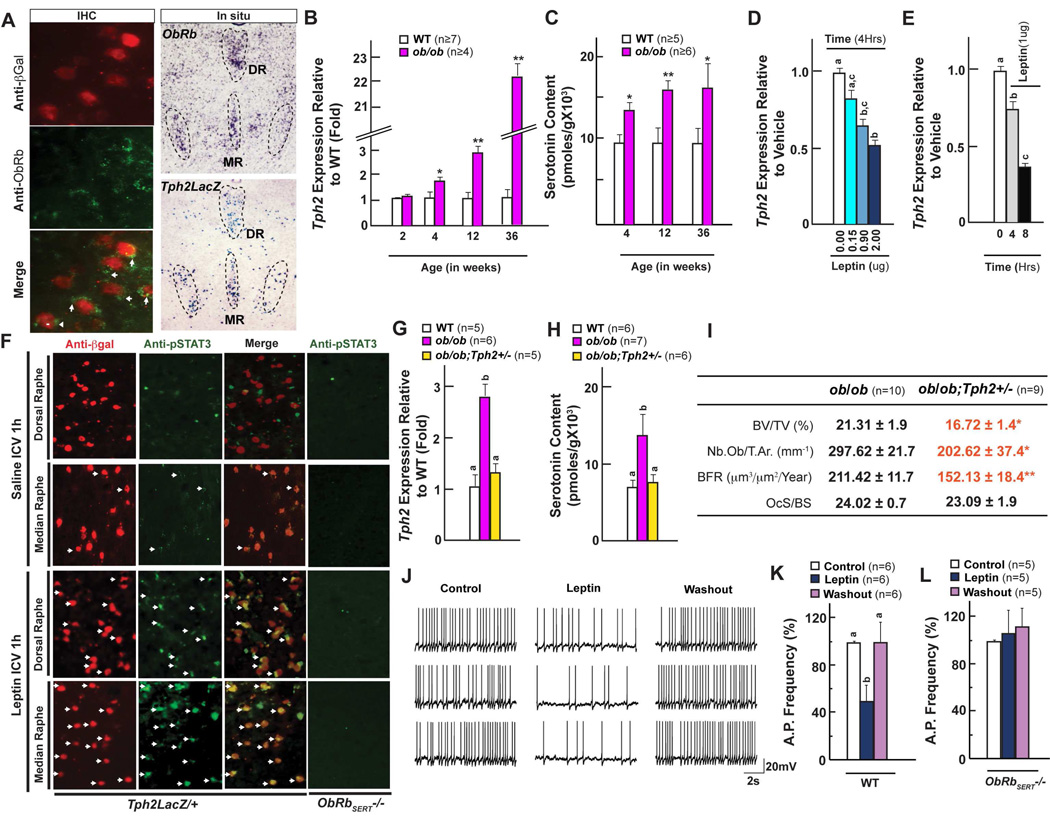
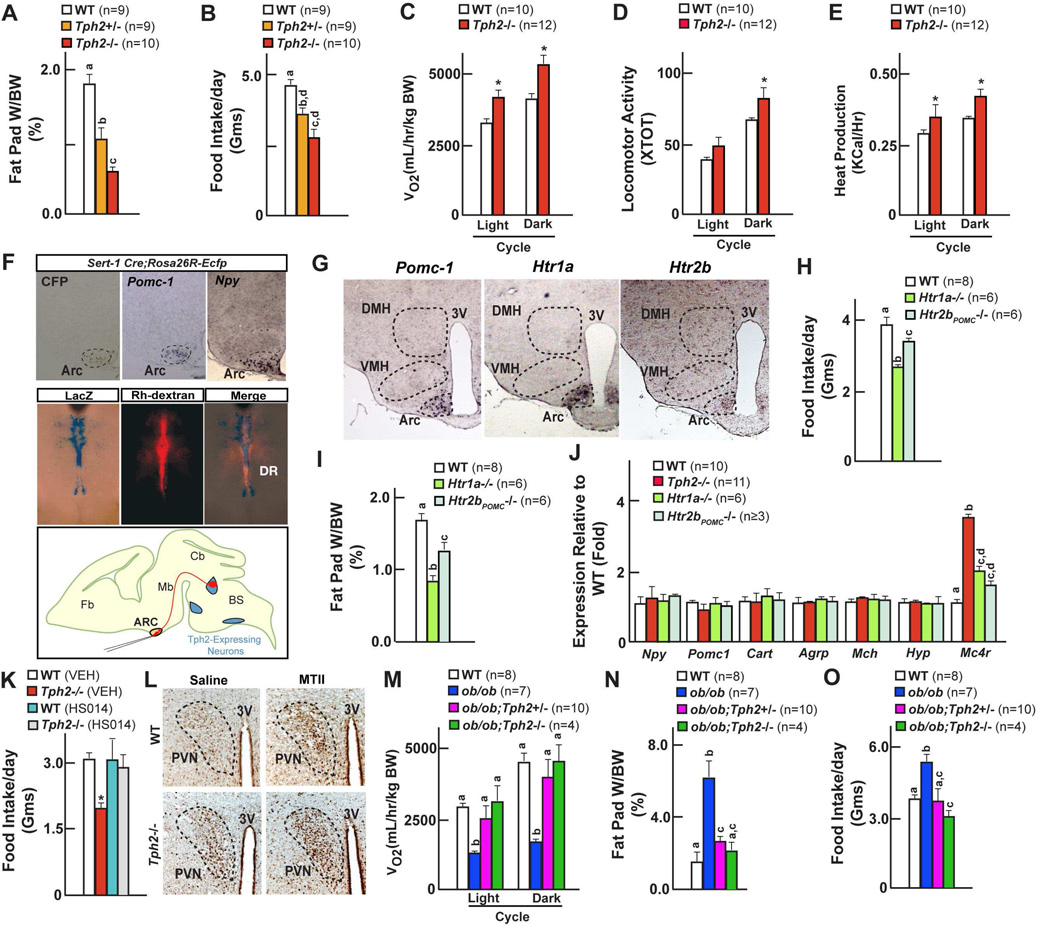
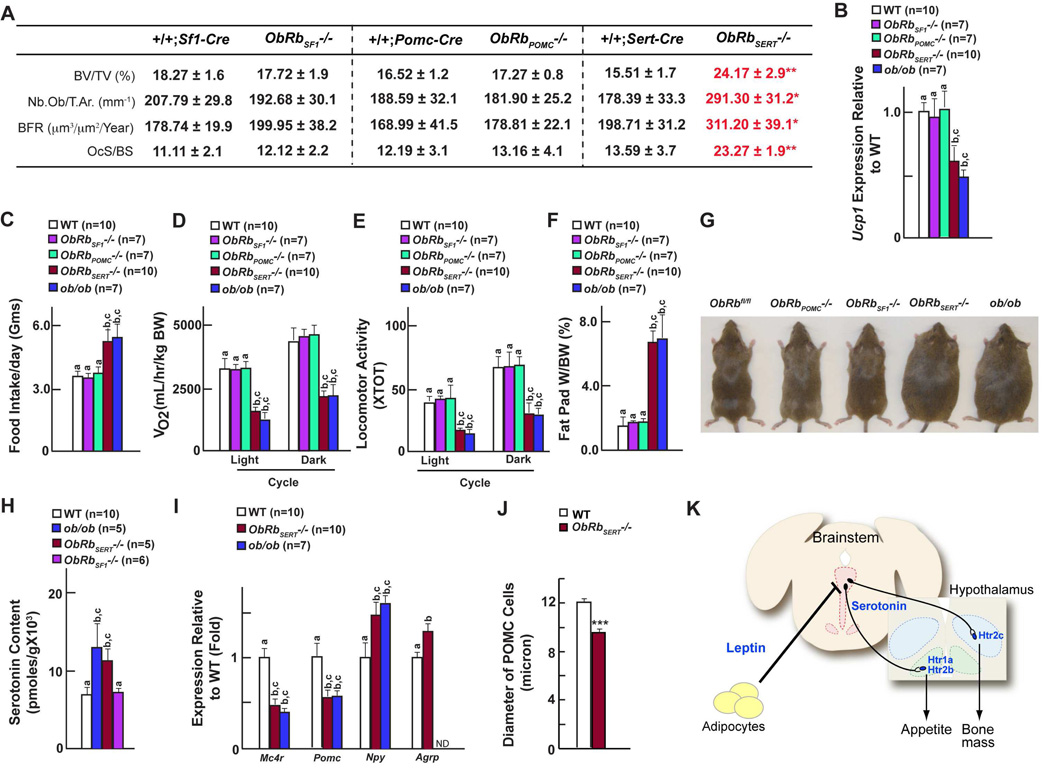
Leptin inhibition of bone mass accrual requires the integrity of specific hypothalamic neurons but not expression of its receptor on these neurons. The same is true for its regulation of appetite and energy expenditure. This suggests that leptin acts elsewhere in the brain to achieve these three functions. We show here that brainstem-derived serotonin (BDS) favors bone mass accrual following its binding to Htr2c receptors on ventromedial hypothalamic neurons and appetite via Htr1a and 2b receptors on arcuate neurons. Leptin inhibits these functions and increases energy expenditure because it reduces serotonin synthesis and firing of serotonergic neurons. Accordingly, while abrogating BDS synthesis corrects the bone, appetite and energy expenditure phenotypes caused by leptin deficiency, inactivation of the leptin receptor in serotonergic neurons recapitulates them fully. This study modifies the map of leptin signaling in the brain and identifies a molecular basis for the common regulation of bone and energy metabolisms. For a video summary of this article, see the PaperFlick file with the Supplemental Data available online.


Figures

Figure 1
Figure 1. Generation of Tph2−/− mice
(A) β-Galactosidase staining in the mouse brain during embryonic (E12.5–18.5) development. A: Anterior; P: Posterior. (B) Localization of Tph2-expressing neurons in the Dorsal (DR; from Bregma −4.04 to −5.49), Median (MR; from Bregma −4.04 to −4.48) and Caudal raphe (CR; from Bregma −4.84 to −7.48) in coronal sections of a mouse brain. (C) Tph2 expression by in situ hybridization, β-galactosidase staining and co-immunolocalization in Tph2LacZ/+ mice. Arrowheads indicate Tph2/ β-Gal double positive cells. (D) Real-time PCR (qPCR) analysis of Tph2 expression in tissues of WT mice. (E) qPCR analysis of Tph2 expression in brainstem (BS) and duodenum (Duod) of WT and Tph2−/− mice. (F) HPLC analysis of serotonin levels in different regions of brain in WT, Tph2+/− and Tph2−/− mice. (G) Serum serotonin levels in WT, Tph2+/− and Tph2−/− mice. (H) Mean litter size, serum biochemistry and body length in WT, Tph2+/− and Tph2−/− mice (n is indicated in superscript above each value). All panels (except F) * P < 0.05; ** P < 0.01 (Student’s t test). Error bars, SEM. Panel F (One way ANOVA, Newman-Keuls test); Different letters on 2 or more bars indicate significant differences between the respective groups (P < 0.05).
Figure 2
Figure 2. Low bone mass in Tph2−/− mice
(A–B) Histological analysis of vertebrae (A) and long bones (B) of WT, Tph2+/− and Tph2−/− mice. Mineralized bone matrix is stained in black by von Kossa reagent. Histomorphometric parameters. BV/TV%, bone volume over trabecular volume; Nb.Ob/T.Ar., number of osteoblasts per trabecular area; BFR, bone formation rate; OcS/BS, osteoclast surface per bone surface. (C) BV/TV% analysis in WT and Tph2−/− mice at 4, 6, 8 and 12 weeks after birth. (D) Lower bone density in long bones of 12-week-old Tph2−/− mice by µCT analysis along with lower Tb.Th (trabecular thickness) and decreased connectivity density (Conn.D). (E) Serum Dpd levels in WT and Tph2−/− mice. All panels * P < 0.05; ** P < 0.01 Error bars, SEM)
Figure 3
Figure 3. Brain-derived serotonin inhibits sympathetic activity
(A–B) HPLC analysis of serotonin levels in different regions of brain and serum serotonin levels in WT and Tph1−/−;Tph2−/− mice. (C) Histomorphometric analysis of vertebrae of WT, Tph1−/−, Tph2−/− and Tph1−/−;Tph2−/− mice. (D) Epinephrine levels in WT, Tph2+/−, Tph2−/− and Tph1−/−;Tph2−/− mice. (E) qPCR analysis of Ucp1 expression in brown adipose tissue of WT, Tph2+/−, Tph2−/− and Tph1−/−;Tph2−/− mice. (F) Epinephrine levels in the urine of WT, Tph2−/− and Tph2−/−;Adrβ2+/− mice. (G) Histomorphometric analysis of vertebrae of WT, Tph2−/− and Tph2−/−;Adrβ2+/− mice. All panels (except D and E) * P < 0.05; ** P < 0.01 (Student’s t test). Error bars, SEM. Panel D and E (One way ANOVA, Newman-Keuls test); Different letters on 2 or more bars indicate significant differences between the respective groups (P < 0.05).
Figure 4
Figure 4. Serotonin promotes bone mass through Htr2c receptors in VMH
(A–C) Analysis of axonal projections emanating from the serotonergic neurons of the brainstem. Coronal sections through the Dorsal (DR), Median (MR) raphe and ventromedial hypothalamus (VMH) nuclei from Sert-Cre;Rosa26REcfp mice identifying serotonergic neurons and their axonal projections to VMH neurons through Ecfp immunohistochemistry (A). Retrograde (B) and anterograde (C) Rhodamine dextran labeling (Rh-dextran) in Tph2LacZ/+ mice. Coronal sections through the brainstem and hypothalamus showing colocalization of β-galactosidase staining and Rh-dextran fluorescence. (D) qPCR analysis of serotonin receptor expression in hypothalamus. (E) Double fluorescence situ hybridization analysis of Htr2c expression with Pomc or Sf1 expression in anterior (Top panel) and posterior (Bottom panel) VMH and arcuate nuclei. The third ventricle is outlined by a white line. (F) Histomorphometric analysis of vertebrae of WT, Htr2c−/−, Htr2c+/−, Tph2+/− and Htr2c+/− ;Tph2+/− mice. (G–H) qPCR analysis of Ucp1 expression in brown adipose tissue (G) and epinephrine levels in urine (H) in WT, Htr2c−/− and Htr2cSF1+/+ mice. (I) Histomorphometric analysis of vertebrae of WT, Htr2cloxTB−/− and Htr2cSF1+/+ mice. (J) HPLC analysis of glutamate levels in hypothalamus of WT and Htr2c−/− mice All panels (except J) * P < 0.05; ** P < 0.01 (Student’s t test). Error bars, SEM. Panel J (One way ANOVA, Newman-Keuls test); Different letters on 2 or more bars indicate significant differences between the respective groups (P < 0.05).
Figure 5
Figure 5. Leptin inhibits bone mass accrual by inhibiting brain-derived serotonin synthesis
(A) In situ hybridization analysis and co-immunolocalization of ObRb expression in serotonergic neurons. (B–C) qPCR analysis of Tph2 expression (B) and brainstem serotonin content (C) at different ages in WT and ob/ob female mice. (D–E) qPCR analysis of Tph2 expression following intra-cerebroventricular (ICV) infusion of leptin at different doses (D) and at different time points (E) in WT mice. (F) Immunohistochemical analysis of STAT3 phosphorylation in the dorsal and median raphe following leptin ICV. Arrows indicate pSTAT3/ β-Gal positive cells. (G–H) qPCR analysis of Tph2 expression (G) and brainstem serotonin content (H) in WT, ob/ob and ob/ob;Tph2+/− mice. (I) Histomorphometric analysis of vertebrae of ob/ob and ob/ob;Tph2+/− mice. (J) Representative traces of action potentials recorded from WT mice before, during and after the application of leptin (100nM). R.M.P. −43.0 mV. (K–L) Analysis of serotonergic neuron action potential (AP) frequency in brainstem slices from WT (K) and ObRbSERT−/− (L) mice. All panels (except D, E, G, H and K) * P < 0.05; ** P < 0.01 (Student’s t test). Error bars, SEM. Panels D, E, G, H and K (One way ANOVA, Newman-Keuls test); Different letters on 2 or more bars indicate significant differences between the respective groups (P < 0.05).
Figure 6
Figure 6. Serotonin promotes food intake through Htr1a and Htr2b receptors on arcuate neurons
(A–B) Fat pad weights (A) and food intake (B) in WT, Tph2+/− and Tph2−/− mice. (C–E) Energy expenditure in WT and Tph2−/− mice; measured by volume of oxygen consumption (VO2) (C), locomotor activity (D) and Heat production (E). (F) Analysis of axonal projections emanating from the serotonergic neurons. Cross of Sert-Cre and Rosa26REcfp mice identified projections reaching arcuate (Arc) nuclei in the hypothalamus through Ecfp immunohistochemistry colocalized to molecular markers of arcuate neurons (Pomc-1 and Npy) by in situ hybridization. Retrograde Rhodamine dextran labeling of the arcuate neurons identified serotonergic neurons in the brainstem in Tph2LacZ/+ mice through colocalization of β-galactosidase staining and Rh-dextran fluorescence in serotonergic neurons of the brainstem. (G) In situ hybridization analysis of Htr1a, Htr2b in Pomc1-expressing arcuate neurons of the hypothalamus. 3V: third ventricle. (H–I) Food intake (H) and fat pad weights (I) in WT, Htr1a−/− and Htr2bPOMC−/− mice. (J) qPCR analysis of hypothalamic gene expression in WT, Htr1a−/− and Htr2bPOMC−/− mice. (K) Food intake in WT, Tph2−/− mice before and after Mc4r antagonist (HS014) administration. (L) cFos induction in paraventricular nucleus of hypothalamus in WT, Tph2−/− mice before and after acute administration Mc4r agonist (MTII). 3V: third ventricle. (M–O) Volume of oxygen consumption (M), fat pad weight (N) and food intake (O) in WT, ob/ob, ob/ob;Tph2+/− and ob/ob;Tph2−/− mice. All panels (except A–B, H–J and M–O) * P < 0.05; ** P < 0.01 (Student’s t test). Error bars, SEM. Panels A–B, H–J and M–O (One way ANOVA, Newman-Keuls test); Different letters on 2 or more bars indicate significant differences between the respective groups (P < 0.05).
Figure 7
Figure 7. ObRb expression in serotonergic neurons is necessary and sufficient for leptin regulation of bone mass accrual, appetite and energy expenditure
(A) Histomorphometric analysis (vertebrae) of +/+;Sf1-Cre, ObRbSF1−/−, +/+;Pomc1-Cre, ObRbPOMC−/−, +/+;Sert-Cre and ObRbSERT−/− mice. (B) qPCR analysis of Ucp1 expression in brown adipose tissue in WT, ObRbSF1−/−, ObRbPOMC−/− and ObRbSERT−/− mice. WT refers to +/+;Sf1-Cre, +/+;Pomc1-Cre or +/+;Sert-Cre. (C–F) Food intake (C) volume of oxygen consumption (D), locomoter activity (E) and fat pad weights (F) in WT, ObRbSF1−/−, ObRbPOMC−/− and ObRbSERT−/− mice. (G) Representative photomicrographs of WT, ObRbSF1−/−, ObRbPOMC−/− and ObRbSERT−/− mice. (H) Brainstem serotonin content in WT, ob/ob, ObRbSERT−/− and ObRbSF1−/− mice. (I) qPCR analysis in the hypothalamus in WT, ObRbSERT−/− and ob/ob mice. (J) Diameter of Pomc-expressing cells in WT and ObRbSERT−/− mice. (K) Model of the leptin-dependent regulation of bone mass and appetite. Leptin inhibits release of brainstem-derived serotonin, which favors bone mass accrual and appetite. Adipocytes are in yellow; serotonergic neurons are in pink; VMH is in blue and arcuate is in green. All panels (except B–F and H–I) * P < 0.05; ** P < 0.01, *** P < 0.001 (Student’s t test). Error bars, SEM. Panels B–F and H–I (One way ANOVA, Newman-Keuls test); Different letters on 2 or more bars indicate significant differences between the respective groups (P < 0.05).

References

    1. Aston-Jones G, Akaoka H, Charlety P, Chouvet G. Serotonin selectively attenuates glutamate-evoked activation of noradrenergic locus coeruleus neurons. J Neurosci. 1991;11:760–769. - PMC - PubMed
    1. Balthasar N, Coppari R, McMinn J, Liu SM, Lee CE, Tang V, Kenny CD, McGovern RA, Chua SC, Jr., Elmquist JK, et al. Leptin receptor signaling in POMC neurons is required for normal body weight homeostasis. Neuron. 2004;42:983–991. - PubMed
    1. Cohen P, Zhao C, Cai X, Montez JM, Rohani SC, Feinstein P, Mombaerts P, Friedman JM. Selective deletion of leptin receptor in neurons leads to obesity. J Clin Invest. 2001;108:1113–1121. - PMC - PubMed
    1. Coppari R, Ichinose M, Lee CE, Pullen AE, Kenny CD, McGovern RA, Tang V, Liu SM, Ludwig T, Chua SC, Jr., et al. The hypothalamic arcuate nucleus: a key site for mediating leptin's effects on glucose homeostasis and locomotor activity. Cell Metab. 2005;1:63–72. - PubMed
    1. Dhillon H, Zigman JM, Ye C, Lee CE, McGovern RA, Tang V, Kenny CD, Christiansen LM, White RD, Edelstein EA, et al. Leptin directly activates SF1 neurons in the VMH, and this action by leptin is required for normal body-weight homeostasis. Neuron. 2006;49:191–203. - PubMed

Publication types