

Exploring kainate receptor pharmacology using molecular dynamics simulations
- PMID: 19737573
- PMCID: PMC2876335
- DOI: 10.1016/j.neuropharm.2009.08.019
Exploring kainate receptor pharmacology using molecular dynamics simulations
Abstract
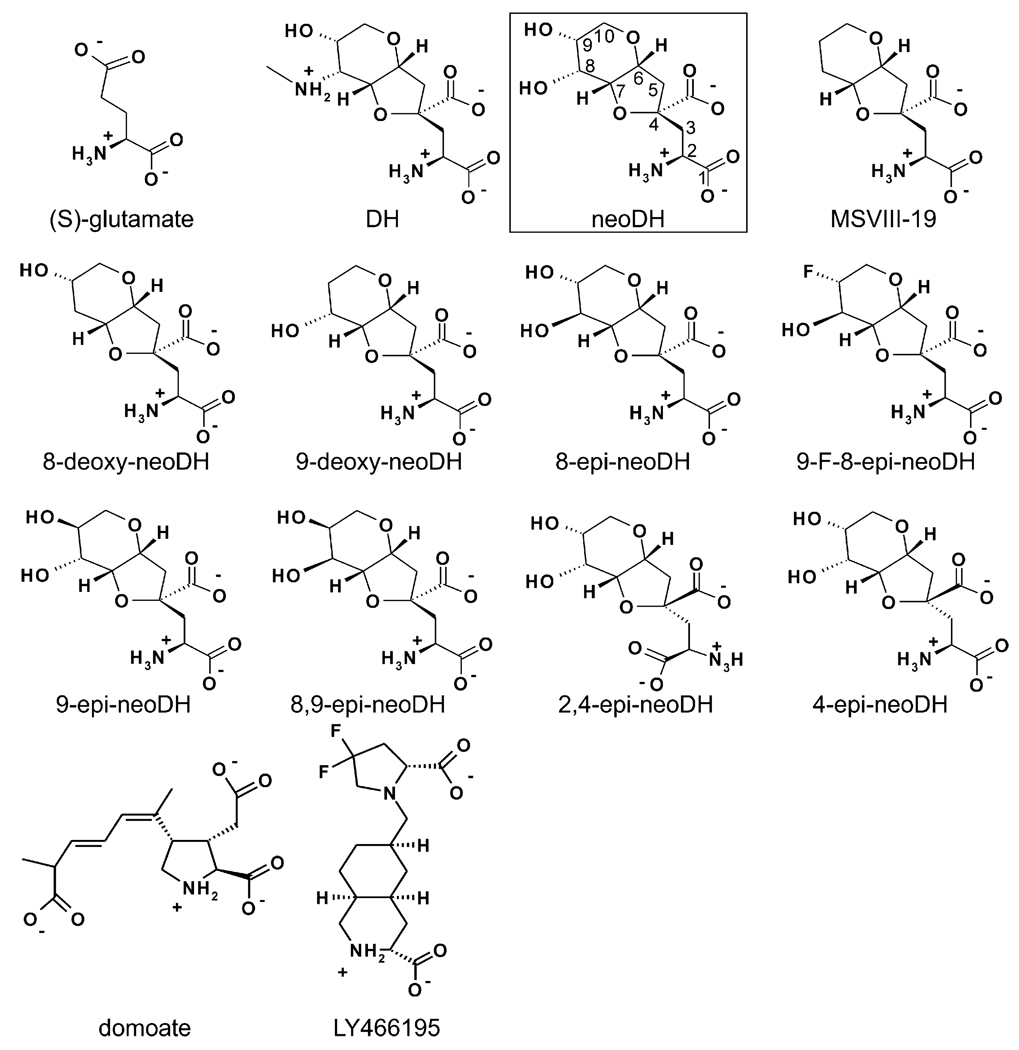
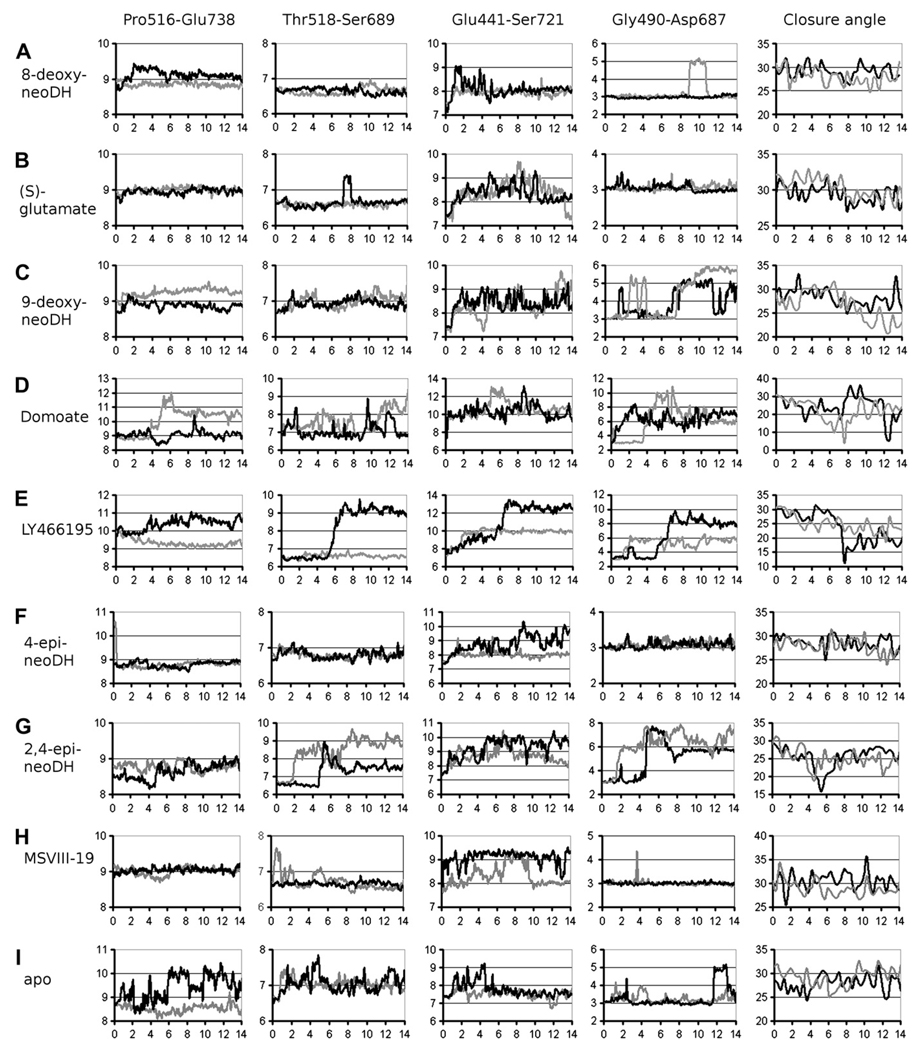
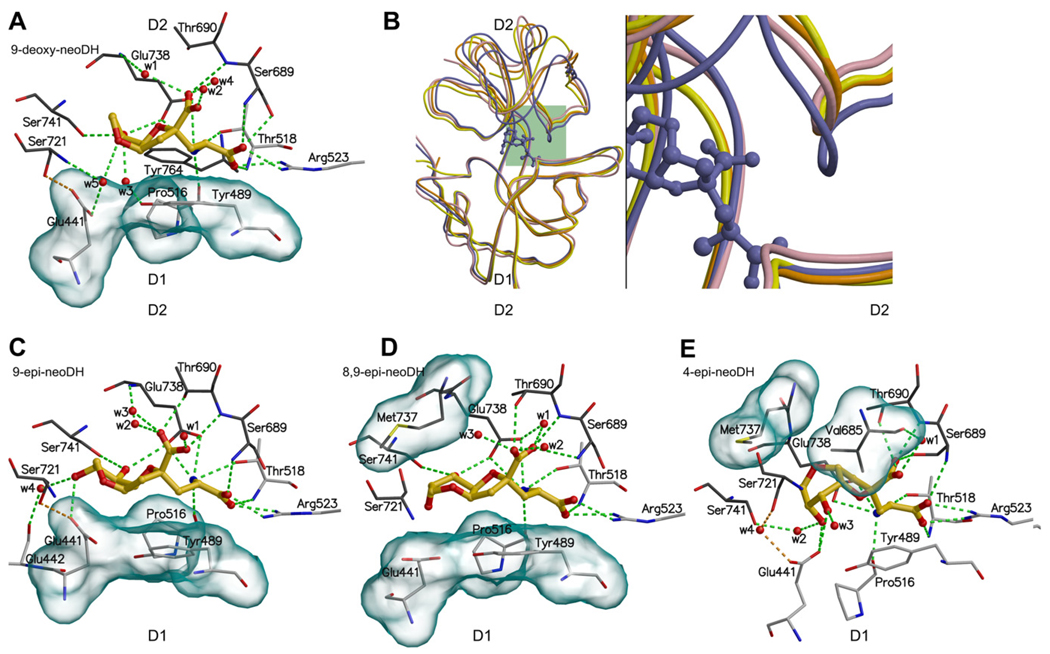
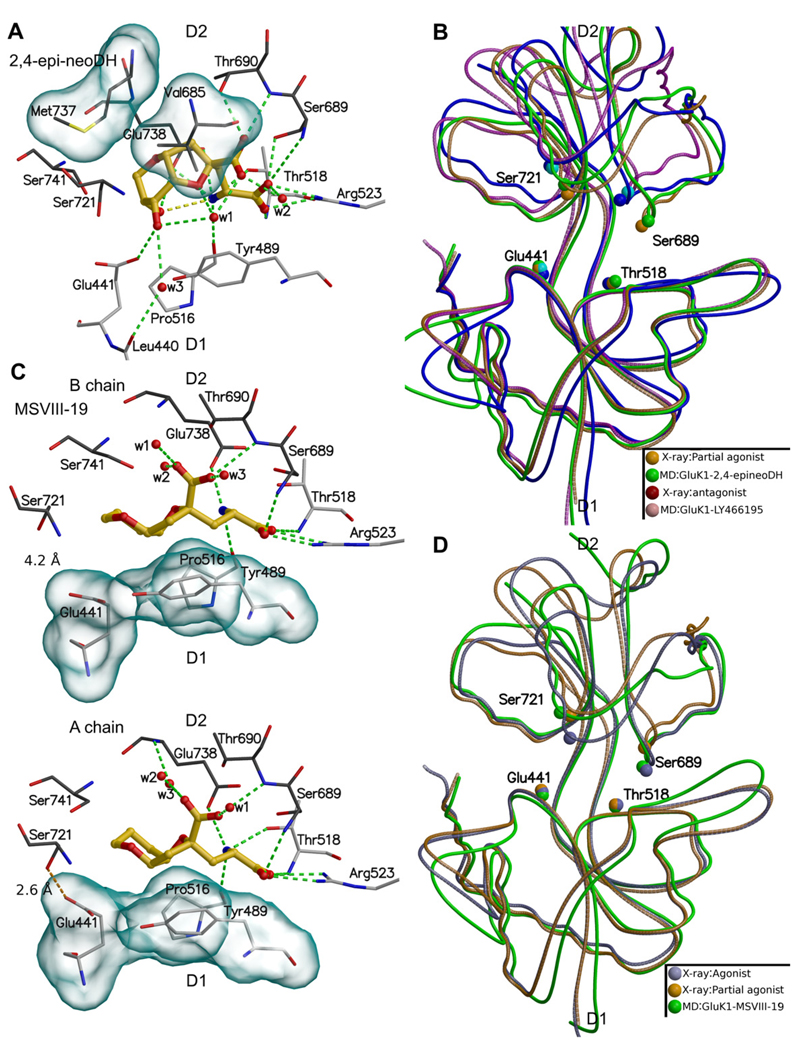
Ionotropic glutamate receptors (iGluRs) are enticing targets for pharmaceutical research; however, the search for selective ligands is a laborious experimental process. Here we introduce a purely computational procedure as an approach to evaluate ligand-iGluR pharmacology. The ligands are docked into the closed ligand-binding domain and during the molecular dynamics (MD) simulation the bi-lobed interface either opens (partial agonist/antagonist) or stays closed (agonist) according to the properties of the ligand. The procedure is tested with closely related set of analogs of the marine toxin dysiherbaine bound to GluK1 kainate receptor. The modeling is set against the abundant binding data and electrophysiological analyses to test reproducibility and predictive value of the procedure. The MD simulations produce detailed binding modes for analogs, which in turn are used to define structure-activity relationships. The simulations suggest correctly that majority of the analogs induce full domain closure (agonists) but also distinguish exceptions generated by partial agonists and antagonists. Moreover, we report ligand-induced opening of the GluK1 ligand-binding domain in free MD simulations. The strong correlation between in silico analysis and the experimental data imply that MD simulations can be utilized as a predictive tool for iGluR pharmacology and functional classification of ligands.
2009 Elsevier Ltd. All rights reserved.
Figures
Similar articles
-
Pharmacological activity of C10-substituted analogs of the high-affinity kainate receptor agonist dysiherbaine.Neuropharmacology. 2010 Mar;58(3):640-9. doi: 10.1016/j.neuropharm.2009.11.013. Epub 2009 Dec 4. Neuropharmacology. 2010. PMID: 19962997 Free PMC article.
-
Full domain closure of the ligand-binding core of the ionotropic glutamate receptor iGluR5 induced by the high affinity agonist dysiherbaine and the functional antagonist 8,9-dideoxyneodysiherbaine.J Biol Chem. 2009 May 22;284(21):14219-29. doi: 10.1074/jbc.M808547200. Epub 2009 Mar 18. J Biol Chem. 2009. PMID: 19297335 Free PMC article.
-
Binding and selectivity of the marine toxin neodysiherbaine A and its synthetic analogues to GluK1 and GluK2 kainate receptors.J Mol Biol. 2011 Oct 28;413(3):667-83. doi: 10.1016/j.jmb.2011.08.043. Epub 2011 Aug 26. J Mol Biol. 2011. PMID: 21893069
-
Subtype selective kainic acid receptor agonists: discovery and approaches to rational design.Med Res Rev. 2009 Jan;29(1):3-28. doi: 10.1002/med.20133. Med Res Rev. 2009. PMID: 18623169 Review.
-
Lessons from crystal structures of kainate receptors.Neuropharmacology. 2017 Jan;112(Pt A):16-28. doi: 10.1016/j.neuropharm.2016.05.014. Epub 2016 May 26. Neuropharmacology. 2017. PMID: 27236079 Review.
Cited by
-
The GluN2B-Glu413Gly NMDA receptor variant arising from a de novo GRIN2B mutation promotes ligand-unbinding and domain opening.Proteins. 2018 Dec;86(12):1265-1276. doi: 10.1002/prot.25595. Epub 2018 Oct 5. Proteins. 2018. PMID: 30168177 Free PMC article.
-
Structural basis of GluK2 kainate receptor activation by a partial agonist.Nat Struct Mol Biol. 2025 Aug;32(8):1456-1469. doi: 10.1038/s41594-025-01566-w. Epub 2025 May 29. Nat Struct Mol Biol. 2025. PMID: 40442317
-
Structural mechanism of N-methyl-D-aspartate receptor type 1 partial agonism.PLoS One. 2012;7(10):e47604. doi: 10.1371/journal.pone.0047604. Epub 2012 Oct 15. PLoS One. 2012. PMID: 23077649 Free PMC article.
-
Pharmacological activity of C10-substituted analogs of the high-affinity kainate receptor agonist dysiherbaine.Neuropharmacology. 2010 Mar;58(3):640-9. doi: 10.1016/j.neuropharm.2009.11.013. Epub 2009 Dec 4. Neuropharmacology. 2010. PMID: 19962997 Free PMC article.
-
Selective effect of cell membrane on synaptic neurotransmission.Sci Rep. 2016 Jan 19;6:19345. doi: 10.1038/srep19345. Sci Rep. 2016. PMID: 26782980 Free PMC article.
References
-
- Alt A, Weiss B, Ogden AM, Knauss JL, Oler J, Ho K, Large TH, Bleakman D. Pharmacological characterization of glutamatergic agonists and antagonists at recombinant human homomeric and heteromeric kainate receptors in vitro. Neuropharmacology. 2004;46:793–806. - PubMed
-
- Armstrong N, Gouaux E. Mechanisms for activation and antagonism of an ampa-sensitive glutamate receptor: crystal structures of the glur2 ligand binding core. Neuron. 2000;28:165–181. - PubMed
-
- Armstrong N, Sun Y, Chen GQ, Gouaux E. Structure of a glutamate-receptor ligand-binding core in complex with kainate. Nature. 1998;395:913–917. - PubMed
Publication types
MeSH terms
Substances
Grants and funding
LinkOut - more resources
Full Text Sources
