. 2009 Dec 15;185(1):15-22.
doi: 10.1016/j.jneumeth.2009.08.022. Epub 2009 Sep 6.

Visualizing the entire cortical myelination pattern in marmosets with magnetic resonance imaging

Affiliations

Visualizing the entire cortical myelination pattern in marmosets with magnetic resonance imaging

Nicholas A Bock et al. J Neurosci Methods. .

Abstract

Myeloarchitecture, the pattern of myelin density across the cerebral cortex, has long been visualized in histological sections to identify distinct anatomical areas of the cortex. In humans, two-dimensional (2D) magnetic resonance imaging (MRI) has been used to visualize myeloarchitecture in select areas of the cortex, such as the stripe of Gennari in the primary visual cortex and Heschl's gyrus in the primary auditory cortex. Here, we investigated the use of MRI contrast based on longitudinal relaxation time (T(1)) to visualize myeloarchitecture in vivo over the entire cortex of the common marmoset (Callithrix jacchus), a small non-human primate that is becoming increasingly important in neuroscience and neurobiology research. Using quantitative T(1) mapping, we found that T(1) at 7T in a cortical region with a high myelin content was 15% shorter than T(1) in a region with a low myelin content. To maximize this T(1) contrast for imaging cortical myelination patterns, we optimized a magnetization-prepared rapidly acquired gradient echo (MP-RAGE) sequence. In whole-brain, 3D T(1)-weighted images made in vivo with the sequence, we identified six major cortical areas with high myelination and confirmed the results with histological sections stained for myelin. We also identified several subtle features of myeloarchitecture, showing the sensitivity of our technique. The ability to image myeloarchitecture over the entire cortex may prove useful in studies of longitudinal changes of the topography of the cortex associated with development and neuronal plasticity, as well as for guiding and confirming the location of functional measurements.


Figures

Figure 1
Figure 1
(Left) A 40 µm thick coronal histological section through the occipital lobe of a marmoset monkey stained for myelin showing the highly myelinated middle temporal area (MT). Figure 1 (Right) A representative in vivo coronal T1 map in a marmoset showing the regions of interest (ROIs) used to measure tissue T1s. The map is masked to only show the brain. (GM = gray matter, GM (high) = high myelin content gray matter in the middle temporal area, WM = white matter).
Figure 2
Figure 2
40 µm thick coronal myelin-stained histology sections through the marmoset brain and corresponding 167 µm slices from an in vivo T1-weighted MRI. The MRIs are masked to only show the brain and presented on a gray background to make the edges of the cortex visible. The number in the upper right hand corner of each MRI indicates the order of the slices from rostral to caudal. (FEF = frontal eye fields, A1 = primary auditory cortex, S1 = primary somatosensory cortex, MT = middle temporal area, DM = dorsomedial area, V1 = primary visual cortex). Note that the contrast is reversed in the two types of images, with myelinated areas appearing dark in the histological sections and bright in the MRI.
Figure 3
Figure 3
Volume renderings of 3D T1-weighted MP-RAGE images in two marmosets. Marmoset 1) A nine-year-old female marmoset imaged in one session with six averages of the MP-RAGE sequence. The marmoset was sacrificed for histology following the imaging session. Marmoset 2) Another nine-year-old female marmoset imaged in two sessions of three averages each. The marmoset was recovered following each session. The images from both sessions were co-registered prior to volume rendering. Major myelinated areas of the cortex are shown by the labels. (D = dorsal, V = ventral, A = anterior, P = posterior)
Figure 4
Figure 4
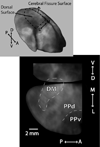
Tangential views of volume-rendered 3D MRI data in the occipital cortex in Marmoset 1. The cerebral fissure surface has been rotated into the same plane as the dorsal cortex surface for viewing. The border between the primary visual cortex (V1) and the secondary visual cortex (V2) can be seen. As well, an area of enhancement (*) can be seen within V1 which may correspond to the foveal representation. (DM = dorsomedial area, D = dorsal, V = ventral, A = anterior, P = posterior, M = medial, L=lateral)
Figure 5
Figure 5
Tangential views of volume-rendered 3D MRI data in the occipital and parietal cortex in Marmoset 1. The cerebral fissure wall has been rotated into the same plane as the dorsal cortex for viewing. The border between the ventral (PPv) and dorsal (PPd) parietal posterior cortex can be seen. (DM = dorsomedial area, D = dorsal, V = ventral, A = anterior, P = posterior, M = medial, L=lateral)
Figure 6
Figure 6
Tangential views of volume-rendered 3D MRI data in the parietal and temporal cortex in Marmoset 1. The lateral wall of the lateral sulcus has been rotated into the same plane as the dorsal cortex for viewing. The border between the ventral posterior parietal area (PPv) and the middle temporal crescent (MTc) can be seen. (MT = middle temporal area, FST = fundus of the superior temporal area, A1 = primary auditory cortexposterior, D = dorsal, V = ventral, A = anterior, P = posterior, M = medial, L=lateral)
Figure 7
Figure 7
Tangential views of volume-rendered 3D MRI data in the parietal, temporal, and frontal cortex in Marmoset 2. The medial wall of the lateral sulcus and the ventral frontal cortex have been rotated into the same plane as the dorsal cortex for viewing. The posterior border of the lightly enhancing primary motor cortex (M1) is visible. The arrow denotes a lightly enhancing septum separating the hand and face representations in the primary somatosensory cortex (S1). (S2 = secondary somatosensory cortex, FEF = frontal eye fields, 12 = area 12, 13 = area 13, D = dorsal, V = ventral, A = anterior, P = posterior, M = medial, L=lateral)

References

    1. Aitkin L, Park V. Audition and the auditory pathway of a vocal New World primate, the common marmoset. Prog Neurobiol. 1993;3:345–367. - PubMed
    1. Annese J, Pitiot A, Dinov ID, Toga AW. A myelo-architectonic method for the structural classification of cortical areas. Neuroimage. 2004;1:15–26. - PubMed
    1. Barbier E, Marrett S, Danek A, Vortmeyer A, van Gelderen GP, Duyn J, Bandettini P, Grafman J, Koretsky A. Imaging cortical anatomy by high-resolution MR at 3.0T: detection of the stripe of Gennari in visual area 17. Magn ResonMed. 2002;4:735–738. - PubMed
    1. Bendor D, Wang X. The neuronal representation of pitch in primate auditory cortex. Nature. 2005;7054:1161–1165. - PMC - PubMed
    1. Bock NA, Kocharyan A, Silva AC. Manganese-enhanced MRI visualizes V1 in the non-human primate visual cortex. NMR Biomed. 2009;7:730–736. - PMC - PubMed

Publication types

MeSH terms