

Diagnostic change and the increased prevalence of autism
- PMID: 19737791
- PMCID: PMC2800781
- DOI: 10.1093/ije/dyp261
Diagnostic change and the increased prevalence of autism
Abstract
Background: Increased autism prevalence rates have generated considerable concern. However, the contribution of changes in diagnostic practices to increased prevalence rates has not been thoroughly examined. Debates over the role of diagnostic substitution also continue. California has been an important test case in these controversies. The objective of this study was to determine the extent to which the increased prevalence of autism in California has been driven by changes in diagnostic practices, diagnostic substitution and diagnostic accretion.
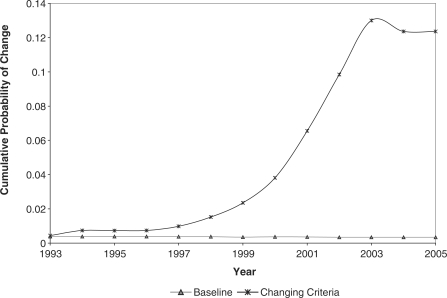
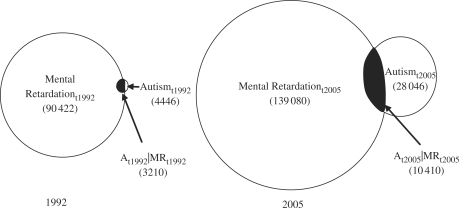
Methods: Retrospective case record examination of 7003 patients born before 1987 with autism who were enrolled with the California Department of Developmental Services between 1992 and 2005 was carried out. Of principal interest were 631 patients with a sole diagnosis of mental retardation (MR) who subsequently acquired a diagnosis of autism. The outcome of interest was the probability of acquiring a diagnosis of autism as a result of changes in diagnostic practices was calculated. The probability of diagnostic change is then used to model the proportion of the autism caseload arising from changing diagnostic practices.
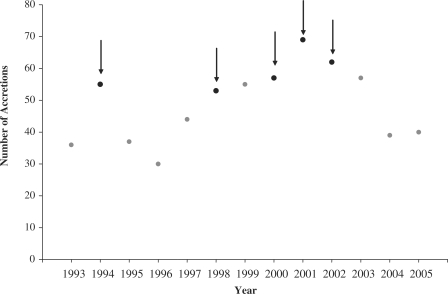
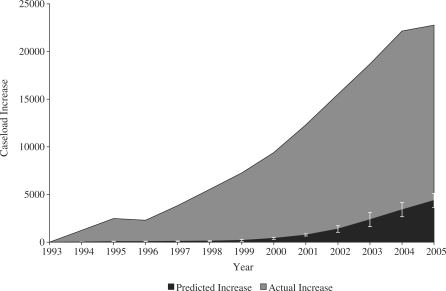
Results: The odds of a patient acquiring an autism diagnosis were elevated in periods in which the practices for diagnosing autism changed. The odds of change in years in which diagnostic practices changed were 1.68 [95% confidence interval (CI) 1.11-2.54], 1.55 (95% CI 1.03-2.34), 1.58 (95% CI 1.05-2.39), 1.82 (95% CI 1.23-2.7) and 1.61 (95% CI 1.09-2.39). Using the probability of change between 1992 and 2005 to generalize to the population with autism, it is estimated that 26.4% (95% CI 16.25-36.48) of the increased autism caseload in California is uniquely associated with diagnostic change through a single pathway--individuals previously diagnosed with MR.
Conclusion: Changes in practices for diagnosing autism have had a substantial effect on autism caseloads, accounting for one-quarter of the observed increase in prevalence in California between 1992 and 2005.
Figures
Comment in
-
Commentary: Diagnostic change and the increased prevalence of autism.Int J Epidemiol. 2009 Oct;38(5):1239-41; author reply 1243-4. doi: 10.1093/ije/dyp258. Epub 2009 Sep 7. Int J Epidemiol. 2009. PMID: 19737792 Free PMC article. No abstract available.
-
Commentary: Fact and artefact in the secular increase in the rate of autism.Int J Epidemiol. 2009 Oct;38(5):1238-9; author reply 1243-4. doi: 10.1093/ije/dyp257. Epub 2009 Sep 7. Int J Epidemiol. 2009. PMID: 19737793 No abstract available.
-
Commentary: Effects of diagnostic thresholds and research vs service and administrative diagnosis on autism prevalence.Int J Epidemiol. 2009 Oct;38(5):1234-8; author reply 1243-4. doi: 10.1093/ije/dyp256. Epub 2009 Sep 7. Int J Epidemiol. 2009. PMID: 19737794 No abstract available.
-
Commentary: on King and Bearman.Int J Epidemiol. 2009 Oct;38(5):1241-2; author reply 1243-4. doi: 10.1093/ije/dyp259. Epub 2009 Sep 7. Int J Epidemiol. 2009. PMID: 19737796 No abstract available.
References
-
- Fommbonne E. The prevalence of autism. JAMA. 2003;289:87–89. - PubMed
-
- Services CDoD. Autistic Spectrum Disorders: Changes in the California Caseload: An Update: 1999 through 2002. Sacramento, California: Department of Health and Human Services Agency, Department of Developmental Services; 2003.
-
- Coo H, Ouellette-Kuntz H, Lloyd J, Kasmara L, Holden J, Lewis S. Trends in autism prevalence: diagnostic substitution revisited. J Autism Dev Disorders. 2008;38:1036–46. - PubMed
-
- Bishop D, Whitehouse A, Watt H, Line E. Autism and diagnostic substitution: evidence from a study of adults with a history of developmental language disorder. Dev Med Child Neurol. 2008;50:341–45. - PubMed
Publication types
MeSH terms
Grants and funding
LinkOut - more resources
Full Text Sources
Other Literature Sources
