

Evaluating dopamine reward pathway in ADHD: clinical implications
- PMID: 19738093
- PMCID: PMC2958516
- DOI: 10.1001/jama.2009.1308
Evaluating dopamine reward pathway in ADHD: clinical implications
Erratum in
- JAMA. 2009 Oct 7;302(13):1420
Abstract
Context: Attention-deficit/hyperactivity disorder (ADHD)--characterized by symptoms of inattention and hyperactivity-impulsivity--is the most prevalent childhood psychiatric disorder that frequently persists into adulthood, and there is increasing evidence of reward-motivation deficits in this disorder.
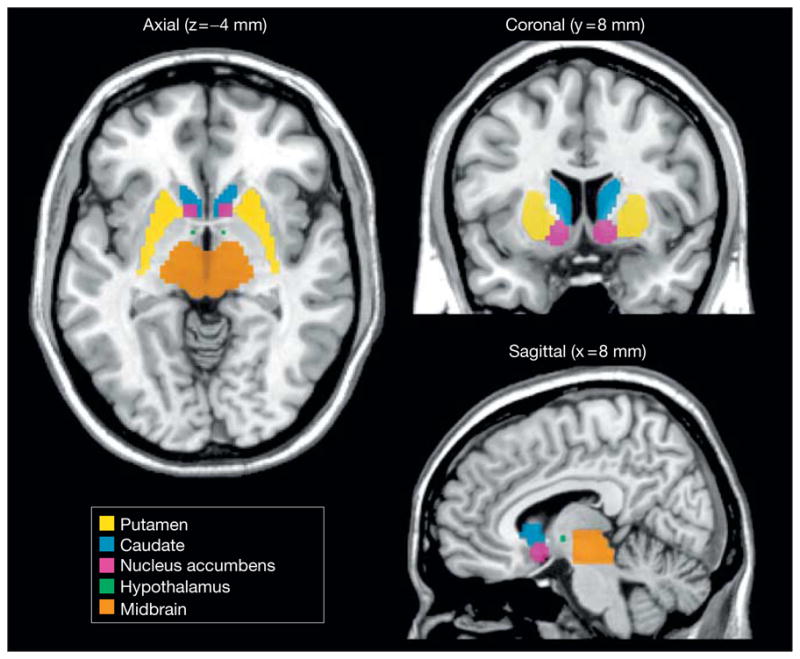
Objective: To evaluate biological bases that might underlie a reward/motivation deficit by imaging key components of the brain dopamine reward pathway (mesoaccumbens).
Design, setting, and participants: We used positron emission tomography to measure dopamine synaptic markers (transporters and D(2)/D(3) receptors) in 53 nonmedicated adults with ADHD and 44 healthy controls between 2001-2009 at Brookhaven National Laboratory.
Main outcome measures: We measured specific binding of positron emission tomographic radioligands for dopamine transporters (DAT) using [(11)C]cocaine and for D(2)/D(3) receptors using [(11)C]raclopride, quantified as binding potential (distribution volume ratio -1).
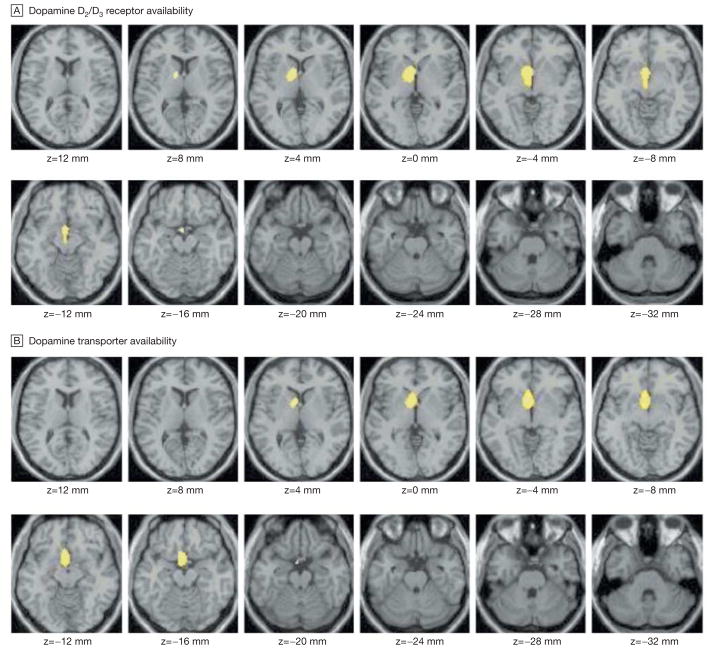
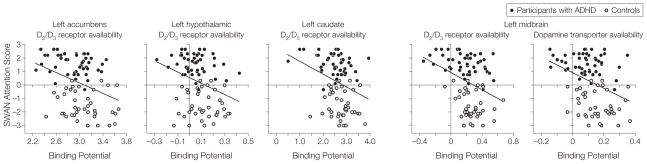
Results: For both ligands, statistical parametric mapping showed that specific binding was lower in ADHD than in controls (threshold for significance set at P < .005) in regions of the dopamine reward pathway in the left side of the brain. Region-of-interest analyses corroborated these findings. The mean (95% confidence interval [CI] of mean difference) for DAT in the nucleus accumbens for controls was 0.71 vs 0.63 for those with ADHD (95% CI, 0.03-0.13, P = .004) and in the midbrain for controls was 0.16 vs 0.09 for those with ADHD (95% CI, 0.03-0.12; P < or = .001); for D(2)/D(3) receptors, the mean accumbens for controls was 2.85 vs 2.68 for those with ADHD (95% CI, 0.06-0.30, P = .004); and in the midbrain, it was for controls 0.28 vs 0.18 for those with ADHD (95% CI, 0.02-0.17, P = .01). The analysis also corroborated differences in the left caudate: the mean DAT for controls was 0.66 vs 0.53 for those with ADHD (95% CI, 0.04-0.22; P = .003) and the mean D(2)/D(3) for controls was 2.80 vs 2.47 for those with ADHD (95% CI, 0.10-0.56; P = .005) and differences in D(2)/D(3) in the hypothalamic region, with controls having a mean of 0.12 vs 0.05 for those with ADHD (95% CI, 0.02-0.12; P = .004). Ratings of attention correlated with D(2)/D(3) in the accumbens (r = 0.35; 95% CI, 0.15-0.52; P = .001), midbrain (r = 0.35; 95% CI, 0.14-0.52; P = .001), caudate (r = 0.32; 95% CI, 0.11-0.50; P = .003), and hypothalamic (r = 0.31; CI, 0.10-0.49; P = .003) regions and with DAT in the midbrain (r = 0.37; 95% CI, 0.16-0.53; P < or = .001).
Conclusion: A reduction in dopamine synaptic markers associated with symptoms of inattention was shown in the dopamine reward pathway of participants with ADHD.
Figures
Comment in
-
Dopamine reward pathway in adult ADHD.JAMA. 2010 Jan 20;303(3):233; author reply 233-4. doi: 10.1001/jama.2009.1999. JAMA. 2010. PMID: 20085951 No abstract available.
-
Dopamine reward pathway in adult ADHD.JAMA. 2010 Jan 20;303(3):232-3; author reply 233-4. doi: 10.1001/jama.2009.1998. JAMA. 2010. PMID: 20085952 No abstract available.
References
-
- National Institutes of Health Consensus Development Conference Statement. J Am Acad Child Adolesc Psychiatry. 2000;39(2):182–193. - PubMed
-
- Dopheide JA, Pliszka SR. Attention-deficit-hyperactivity disorder: an update. Pharmacotherapy. 2009;29(6):656–679. - PubMed
-
- Swanson JM, Kinsbourne M, Nigg J, et al. Etiologic subtypes of attention-deficit/hyperactivity disorder: brain imaging, molecular genetic and environmental factors and the dopamine hypothesis. Neuropsychol Rev. 2007;17(1):39–59. - PubMed
-
- Ernst M, Zametkin AJ, Matochik JA, Pascualvaca D, Jons PH, Cohen RM. High midbrain [18F]DOPA accumulation in children with attention deficit hyper-activity disorder. Am J Psychiatry. 1999;156(8):1209–1215. - PubMed
Publication types
MeSH terms
Substances
Grants and funding
LinkOut - more resources
Full Text Sources
Other Literature Sources
Medical
