. 2009 Sep 8;2(87):ra51.
doi: 10.1126/scisignal.2000396.

Proteomic analysis of integrin-associated complexes identifies RCC2 as a dual regulator of Rac1 and Arf6

Affiliations

Proteomic analysis of integrin-associated complexes identifies RCC2 as a dual regulator of Rac1 and Arf6

Jonathan D Humphries et al. Sci Signal. .

Abstract

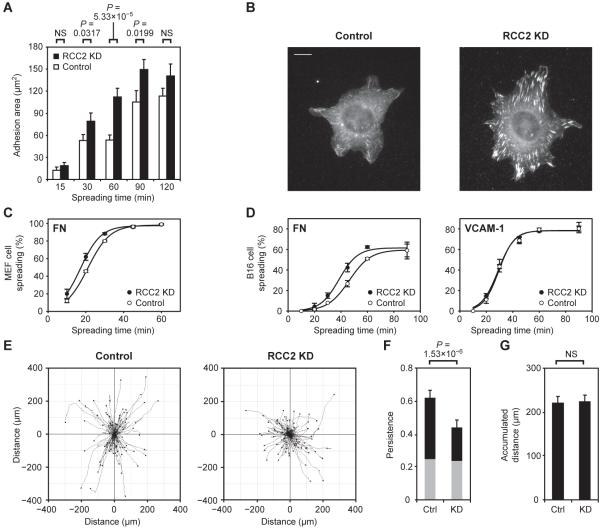
The binding of integrin adhesion receptors to their extracellular matrix ligands controls cell morphology, movement, survival, and differentiation in various developmental, homeostatic, and disease processes. Here, we report a methodology to isolate complexes associated with integrin adhesion receptors, which, like other receptor-associated signaling complexes, have been refractory to proteomic analysis. Quantitative, comparative analyses of the proteomes of two receptor-ligand pairs, alpha(4)beta(1)-vascular cell adhesion molecule-1 and alpha(5)beta(1)-fibronectin, defined both core and receptor-specific components. Regulator of chromosome condensation-2 (RCC2) was detected in the alpha(5)beta(1)-fibronectin signaling network at an intersection between the Rac1 and adenosine 5'-diphosphate ribosylation factor 6 (Arf6) subnetworks. RCC2 knockdown enhanced fibronectin-induced activation of both Rac1 and Arf6 and accelerated cell spreading, suggesting that RCC2 limits the signaling required for membrane protrusion and delivery. Dysregulation of Rac1 and Arf6 function by RCC2 knockdown also abolished persistent migration along fibronectin fibers, indicating a functional role for RCC2 in directional cell movement. This proteomics workflow now opens the way to further dissection and systems-level analyses of adhesion signaling.


Figures

Fig. 1
Fig. 1
A quantitative proteomic pipeline for the analysis of integrin adhesion complexes. (A) Schematic workflow of the ligand affinity isolation strategy in conjunction with MS data acquisition, validation, and interpretation. (B and C) The specific nature of the isolated integrin ligand complexes was demonstrated by Western blotting, as compared with control pulldowns (α-TfR, transferrin receptor antibody; Control, non-integrin-binding VCAM-1 D40A mutant). α5β1–FN cytoskeletal complexes were isolated using the cell membrane–permeable cross-linker DTBP but not the cell membrane–impermeable cross-linker DTSSP (B), and α4β1–VCAM-1 cytoskeletal complexes were isolated with DTBP (C). Bead-coated proteins used for each affinity purification (AP) and proteins probed for by immunoblotting (IB) are indicated. Mouse IgG fragments are indicated by a white arrowhead.
Fig. 2
Fig. 2
Hierarchical clustering of proteins identified by MS analysis of FN, VCAM-1, and control affinity purifications. (A) Complete output of unsupervised hierarchical clustering analysis of identified proteins. Quantitative heat maps display mean spectral counts as a percentage of the total number of spectra identified in each analysis. Associated dendrograms display hierarchical clustering on the basis of uncentered Pearson correlation using complete linkage. Correlations at selected nodes are indicated. (B to E) Selected ligand-specific and core β1 integrin–enriched proteins are displayed, indicated by blue bars in (A).
Fig. 3
Fig. 3
Protein–protein interaction network models for α5β1–FN and α4β1–VCAM-1 complexes. (A and B) Proteins identified in α5β1–FN (A) and α4β1–VCAM-1 (B) complexes after a subtractive proteomics strategy were mapped onto a human interactome to generate interaction network models. Proteins identified within two path lengths (the 2-hop neighborhood) of β1 integrin are shown, with the 1- and 2-hop neighborhoods forming the inner and outer circles, respectively. Protein identifications (nodes) are colored according to their relative enrichment to α5β1–FN (red) or α4β1–VCAM-1 (blue) and are ordered in a clockwise fashion relating to their relative enrichment to α5β1–FN. Proteins identified in both α5β1–FN and α4β1–VCAM-1 datasets are indicated by a black node border; absence of a black border indicates unique identification in that integrin-ligand dataset.
Fig. 4
Fig. 4
Recruitment of RCC2 to FN-bound complexes modulates the activation of Rac1 and Arf6. (A) A focused view of the α5β1–FN network, highlighting the intersection of the β1 integrin, Rac1, and Arf6 1-hop neighborhoods. Protein identifications are colored as described in Fig. 3. Abbreviations: CacyBP/SIP, calcyclin-binding protein/Siah-1–interacting protein; GART, trifunctional purine biosynthetic protein adenosine-3; GDI, GDP dissociation inhibitor; IMPDH2, inosine monophosphate dehydrogenase 2; PFK, phosphofructokinase-1; SF3b155, splicing factor 3b, subunit 1, 155 kD; SRP14, signal recognition particle 14 kD. (B) Verification of the specific recruitment of RCC2 to α5β1–FN complexes by Western blotting. (C to F) The activities of Rac1 (C and D) and Arf6 (E and F) were measured by effector pulldown assays in combination with quantitative Western blotting using fluorophore-conjugated antibodies. Activities were compared between control and RCC2-knockdown cells in suspension (C and E) or during spreading on FN (D and F). Equivalent loading between experiments was confirmed by blotting crude lysates for mitochondrial Hsp70. Axes are in arbitrary units assigned according to the relative activity of cells in suspension. Each panel is representative of at least four separate experiments. Error bars indicate standard error of the mean (SEM); P values were calculated for direct comparisons of peak time points using a Student’s t-test, as indicated.
Fig. 5
Fig. 5
RCC2 modulates FN-dependent adhesion complex formation, cell spreading, and directional migration. (A and B) Adhesion complex formation during spreading of control and RCC2-knockdown MEF cells on FN. Cells were fixed at the indicated times and stained for vinculin to permit measurement of focal adhesion area using ImageJ software (A). Forty-five cells were analyzed for each cell type at each time point. Data are representative of two independent experiments. Images shown are representative of cells that were allowed to spread for 60 min (B). (C and D) Spreading of cells transfected with control or RCC2 siRNAs. The percentage of MEF cells on FN (C) or B16-F10 cells on FN or VCAM-1 (D) counted as spread was plotted as a function of time. The shifts in the measure of half-maximal cell spreading (control minus RCC2-knockdown; mean ± standard deviation) were as follows: MEF cells spread on FN, 3.21 ± 0.68 min (14.9 ± 2.5% acceleration compared to control); B16 cells spread on FN, 8.34 ± 2.44 min (14.1 ± 2.9% acceleration compared to control); B16 cells spread on VCAM-1, −0.40 ± 1.54 min (−0.5 ± 3.3% acceleration compared to control). (E to G) Control and RCC2-knockdown MEF cell migration on cell-derived matrix. Cells were allowed to spread on cell-derived matrix for 3 hours before imaging at 10-min intervals for 12 hours. Migration paths of 90 cells for each cell type were tracked using ImageJ software (E). The tracks of cells from three different fields of view from triplicate wells have been combined into each panel. Data are representative of three independent experiments. Persistence of migration (F) was determined by dividing the linear displacement of a cell by the total distance moved (accumulated distance; G). Grey blocks represent the experimentally determined threshold for the random migration of cells on FN. Error bars indicate SEM; P values were determined using a Z-test, as indicated.

References

    1. Hynes RO. Integrins: Bidirectional, allosteric signaling machines. Cell. 2002;110:673–687. - PubMed
    1. Arnaout MA, Goodman SL, Xiong J-P. Structure and mechanics of integrin-based cell adhesion. Curr. Opin. Cell Biol. 2007;19:495–507. - PMC - PubMed
    1. Humphries JD, Byron A, Humphries MJ. Integrin ligands at a glance. J. Cell Sci. 2006;119:3901–3903. - PMC - PubMed
    1. Geiger B, Bershadsky A, Pankov R, Yamada KM. Transmembrane crosstalk between the extracellular matrix and the cytoskeleton. Nat. Rev. Mol. Cell Biol. 2001;2:793–805. - PubMed
    1. Delon I, Brown NH. Integrins and the actin cytoskeleton. Curr. Opin. Cell Biol. 2007;19:43–50. - PubMed

MeSH terms