. 2009 Sep 7;4(9):e6925.
doi: 10.1371/journal.pone.0006925.

An approach for reliably investigating hippocampal sharp wave-ripples in vitro

Affiliations

An approach for reliably investigating hippocampal sharp wave-ripples in vitro

Nikolaus Maier et al. PLoS One. .

Abstract

Background: Among the various hippocampal network patterns, sharp wave-ripples (SPW-R) are currently the mechanistically least understood. Although accurate information on synaptic interactions between the participating neurons is essential for comprehensive understanding of the network function during complex activities like SPW-R, such knowledge is currently notably scarce.

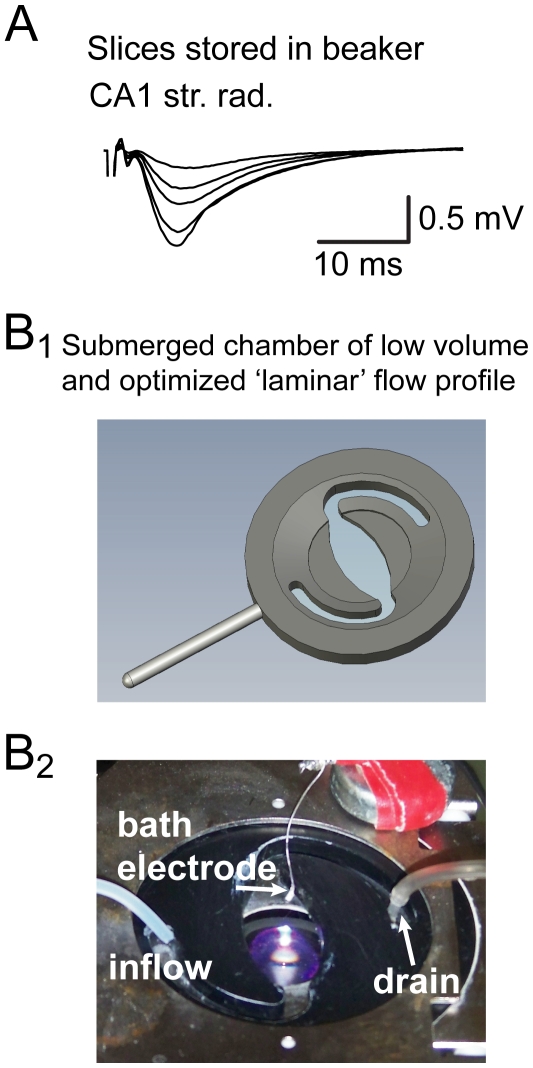
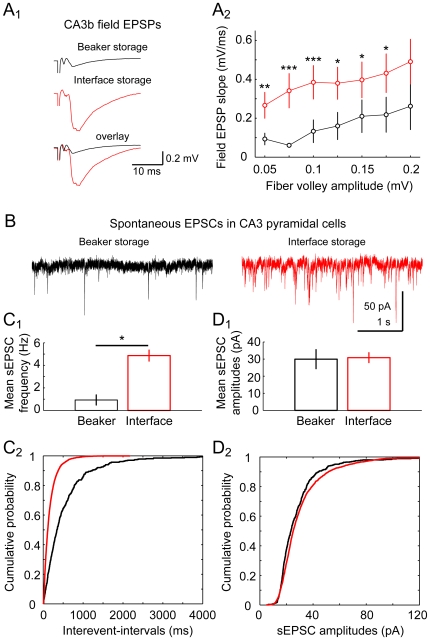
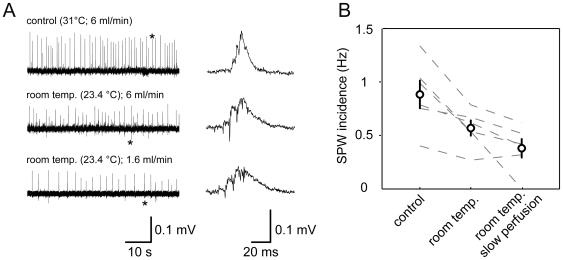
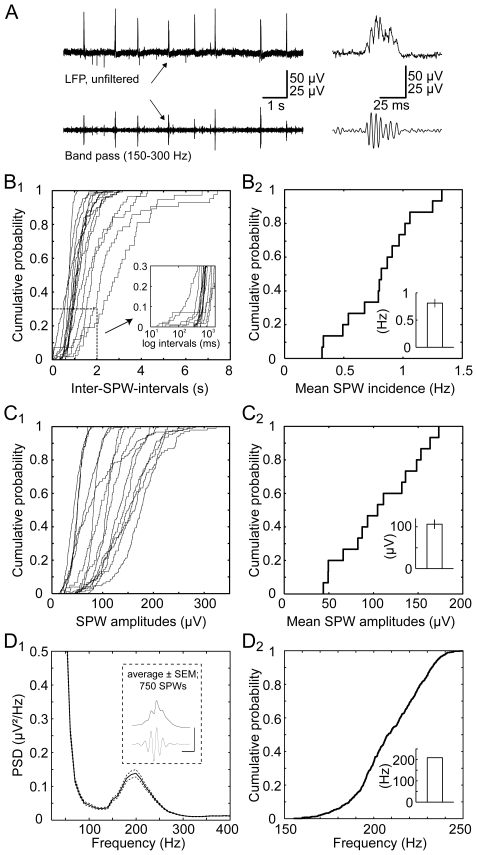
Methodology/principal findings: We demonstrate an in vitro approach to SPW-R that offers a simple experimental tool allowing detailed analysis of mechanisms governing the sharp wave-state of the hippocampus. We combine interface storage of slices with modifications of a conventional submerged recording system and established in vitro SPW-R comparable to their in vivo counterpart. We show that slice storage in the interface chamber close to physiological temperature is the required condition to preserve network integrity that is necessary for the generation of SPW-R. Moreover, we demonstrate the utility of our method for studying synaptic and network properties of SPW-R, using electrophysiological and imaging methods that can only be applied in the submerged system.

Conclusions/significance: The approach presented here demonstrates a reliable and experimentally simple strategy for studying hippocampal sharp wave-ripples. Given its utility and easy application we expect our model to foster the generation of new insight into the network physiology underlying SPW-R.


Conflict of interest statement

Competing Interests: The authors have declared that no competing interests exist.

Figures

Figure 1
Figure 1. Experimental requirements for the reliable expression of sharp wave-ripples in submerged condition in vitro.
A, slices stored in beakers and recorded from in conventional submerged chambers are viable but only anecdotally express sharp wave-ripples. Stimulus-induced field-EPSPs from these slices, however, revealed normal synaptic responses. 100 µs stimulation pulses of different intensities were applied at CA1 Schaffer collateral inputs. Stimulation artifacts are truncated. B1, submerged type recording chamber used throughout this study. The ovaloid shape of the chamber was chosen to enable flow conditions close to an ‘ideal’ laminar flow profile. B2, ‘in situ’ image of the used recording chamber. Str. pyr. and str. rad., stratum pyramidale and stratum radiatum, respectively (n = 48 slices for this study).
Figure 2
Figure 2. Slice storage determines excitability on the network level.
Slices derived from identical preparations were stored in either interface chamber or beaker. A1, field responses in CA3b stratum radiatum were recorded upon stimulation of associational/commissural input. The afferent fiber volley was used as an independent measure of stimulation strength cross slices (see overlay for demonstration of fiber volley comparability). A2, comparison reveals larger field EPSPs in slices derived from interface storage (beaker, 6–11 slices and interface, 9–14 slices, respectively; levels of significance: * P≤0.05, ** P≤0.01, *** P≤0.001). B, in slices stored in beaker or interface, spontaneous EPSCs were recorded in CA3 principal neurons (1 µM gabazine present). Sample traces from both conditions are presented in black and red for beaker and interface storage, respectively. C1, analysis of mean sEPSCs incidence reveals a marked difference depending on storage condition (5 cells from each condition). Accordingly, comparison of cumulated inter-event intervals showed consistently higher values in cells recorded from beaker-stored slices (C2, two-sample Kolmogorov-Smirnov test; P<0.00001). D1, no significant change was found in averaged amplitudes of sEPSC (P = 0.7); comparison of amplitude distributions, however, revealed a small increase of sEPSC amplitudes in cells from interface-stored slices (D2, two-sample Kolmogorov-Smirnov test; P = 0.0001).
Figure 3
Figure 3. Perfusion rate and recording temperature modulate sharp wave incidence in submerged recordings in vitro.
A, example experiment demonstrating the effect of successive reduction of recording temperature and perfusion rate on sharp wave occurrence. Magnified signals correspond to the events marked by asterisk. B, reduction of recording temperature and perfusion speed impairs but does not preclude the generation of sharp waves. Quantification was done 10–20 min after start of the respective experimental interference.
Figure 4
Figure 4. Basal properties of sharp wave-ripples in submerged recording conditions.
A, example experiment of SPW-R sampled in CA1 stratum pyramidale (upper trace). Below: 150–300 Hz band pass-filtered derivatives of the above signal isolating the SPW-associated ripple oscillation. Right: temporally magnified trace segment as indicated by arrows. B1, as a representative sample, in 15 slices the incidence of sharp wave-ripples was determined. Cumulative probability plots show the individual distributions of inter-SPW-intervals as a measure of SPW incidence and illustrating within- and inter-slice variability. Inset: magnification of cumulative functions as indicated. B2, cumulative probability plot of mean values derived from the same 15 slices. Inset indicates mean incidence (0.81±0.08 Hz). C1, from the same pool of data SPW amplitudes were determined. The distributions of amplitudes from the individual experiments are presented, illustrating within- and inter-slice variability of this parameter. C2, mean SPW amplitudes cumulated from the same dataset. Inset represents the mean SPW amplitude (106.2±11.2 µV). D1, from the same pool of data, 50 sharp wave-ripple events were randomly chosen from each experiment. Power spectrum density (PSD) functions were computed on each of these 750 SPWs and averaged. Plot shows the averaged PSD function ± SEM. Inset shows peak-triggered SPW-average and its derived 150–300 Hz filtered ripple oscillation. Calibration: 100 and 25 µV; 10 ms. D2, on these PSD functions, frequency in the ripple frequency band was determined. Cumulative frequency distribution and mean value are shown (208.9±0.7 Hz, inset).
Figure 5
Figure 5. Spatial characteristics of sharp wave-ripples in submerged recordings.
A, serial multisite LFP recordings were performed to reveal the spatial profile of sharp wave-ripples in CA1. A1, infrared-differential contrast (IR-DIC) video image displaying the reference electrode positioned in CA1 stratum radiatum close to CA2 while SPW-R were recorded with a second electrode in CA1 at locations closer to the subiculum (from right, positions as indicated, 10 to 100 µm steps). O, stratum oriens; p, stratum pyramidale; r, stratum radiatum; lm, stratum lacunosum-moleculare; Subic, subiculum. A2, voltage profile of SPW-R of the experiment shown in A1. LFP averages, each representing 20 events, were triggered by the signal sampled with the reference electrode. A3, amplitude depth profile of the example experiment shown in A1-A2. At each recording position with increasing distance to the alveus, the first significant maximum from baseline was determined as the peak of the SPW (see insets for examples regarded as positive and negative events). B, averaged amplitude depth profile (n = 5, solid line) and single depth profile functions (dashed). C, paired LFP recordings in CA3 and CA1 (C1) or subiculum (C2) of the same slice (red and green, respectively). Right: overlay of the indicated events and corresponding ripple signals (150–300 Hz) below. Note the increments of delays of CA1 and subiculum events versus SPWs recorded in CA3. D, normalized crosscorrelation functions to quantify latencies of SPW-R sampled from CA1 and subiculum with respect to the simultaneously recorded reference signal from CA3 (single experiments, dashed; average, bold; red, CA1 (n = 6); green, subiculum (n = 5)). Note increase in latency of subicular versus CA1 sharp waves, representing the spread of SPW-R towards the output structures of the hippocampus.
Figure 6
Figure 6. Targeted patch-clamp recordings from CA1 principal cells during SPW-R.
A1, Pyramidal neurons of area CA1 were characterized electrophysiologically and labeled with biocytin for reconstruction. Injected current steps for characterization correspond to −200, −80, 80, 120, 160 and 280 pA. A2, dual LFP- and close-by (<100 µm) whole cell patch clamp recording during SPW-R. Amplitude and polarity of compound SPW-R-coupled postsynaptic currents depend on the holding potential. Magnified events (right panel) are indicated by boxes (left panel). B, analysis of total charge transfer close to RMP (−74 mV) and depolarized holding potential (−49 mV; 10 cells analyzed).
Figure 7
Figure 7. Population imaging of somatic Ca2+ transients during sharp wave-ripples.
A, high-resolution overview image of an OregonGreen-BAPTA1 bulk-loaded group of cells in the CA1 pyramidal layer of the hippocampus. The white box refers to the subregion imaged for the time-lapse recordings. Compared to the overview picture, Ca2+ measurements were performed on a smaller number of cells limited by the size of the camera chip used for Ca2+ imaging. Single cells can be well distinguished. The asterisk indicates a putative astrocyte. B, LFP recording from stratum radiatum (str. rad.) and corresponding time courses of the somatic Ca2+ signals indicative of suprathreshold activation and subsequent AP firing from cells labelled 1–4 in A. C, raster plot of significant responses imaged in A. Grey dashed lines correspond to peak negativities of sharp waves. Note that significant somatic Ca2+ signals indicative of cellular spiking can be exclusively found temporally coupled to sharp waves.

References

    1. Buzsáki G. Hippocampal sharp waves: their origin and significance. Brain Res. 1986;398:242–252. - PubMed
    1. Buzsáki G, Draguhn A. Neuronal oscillations in cortical networks. Science. 2004;304:1926–1929. - PubMed
    1. Klausberger T, Somogyi P. Neuronal diversity and temporal dynamics: the unity of hippocampal circuit operations. Science. 2008;321:53–57. - PMC - PubMed
    1. Buzsáki G. Two-stage model of memory trace formation: a role for “noisy” brain states. Neuroscience. 1989;31:551–570. - PubMed
    1. Lee AK, Wilson MA. Memory of sequential experience in the hippocampus during slow wave sleep. Neuron. 2002;36:1183–1194. - PubMed

Publication types