. 2009 Aug 17:3:17.
doi: 10.3389/neuro.09.017.2009. eCollection 2009.

Functional brain networks in schizophrenia: a review

Affiliations

Functional brain networks in schizophrenia: a review

Vince D Calhoun et al. Front Hum Neurosci. .

Abstract

Functional magnetic resonance imaging (fMRI) has become a major technique for studying cognitive function and its disruption in mental illness, including schizophrenia. The major proportion of imaging studies focused primarily upon identifying regions which hemodynamic response amplitudes covary with particular stimuli and differentiate between patient and control groups. In addition to such amplitude based comparisons, one can estimate temporal correlations and compute maps of functional connectivity between regions which include the variance associated with event-related responses as well as intrinsic fluctuations of hemodynamic activity. Functional connectivity maps can be computed by correlating all voxels with a seed region when a spatial prior is available. An alternative are multivariate decompositions such as independent component analysis (ICA) which extract multiple components, each of which is a spatially distinct map of voxels with a common time course. Recent work has shown that these networks are pervasive in relaxed resting and during task performance and hence provide robust measures of intact and disturbed brain activity. This in turn bears the prospect of yielding biomarkers for schizophrenia, which can be described both in terms of disrupted local processing as well as altered global connectivity between large-scale networks. In this review we will summarize functional connectivity measures with a focus upon work with ICA and discuss the meaning of intrinsic fluctuations. In addition, examples of how brain networks have been used for classification of disease will be shown. We present work with functional network connectivity, an approach that enables the evaluation of the interplay between multiple networks and how they are affected in disease. We conclude by discussing new variants of ICA for extracting maximally group discriminative networks from data. In summary, it is clear that identification of brain networks and their inter-relationships with fMRI has great potential to improve our understanding of schizophrenia.

Keywords: fMRI; functional connectivity; functional network connectivity; independent component analysis; schizophrenia.


Figures

Figure 1
Figure 1
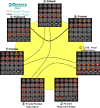
Pair-wise comparisons of the control, schizophrenia, and bipolar groups (from Calhoun et al., 2008b). Two-sample t-tests were performed to illustrate most significant differences for each pair-wise comparison (top left). Note that these maps are generated from all subjects and actual classification regions will be slightly different due to the leave-1-out approach. On the top right is plotted the average beta weights for the stimuli broken out by group. On the bottom is shown a priori decision regions for three-way classification for (A) control (dark yellow) versus non-control (black), (B) schizophrenia (dark pink) versus non-schizophrenia (black), and (C) bipolar (dark green) versus non-bipolar (black). The actual diagnosis of a given individual is indicated by the color of the dot where controls are yellow, schizophrenia patients are pink, and bipolar patients are green. The classification was done on an independent data set each time using a leave-one-out approach. Sensitivity and specificity values were quite encouraging, with an average sensitivity (true positive) of 90% and an average specificity (true negative) of 95%.
Figure 2
Figure 2
Significant correlation between group differences (from Jafri et al., 2008). Out of 21 possible correlation combinations between seven components, only five combinations passed the two sample t-test (p < 0.01). The solid line represents the significant connectivity where controls have higher mean correlation than patients, while dotted line represents connectivity where patients have higher mean correlation. Presence of dotted lines rejects the hypothesis that controls should have more correlation between two components than patients.
Figure 3
Figure 3
Granger causality FNC results (from Demirci et al., 2009). Granger causality test results for SIRP data (A) and auditory oddball data (B). The connections and their directions between brain networks are depicted along with (ftmax; tmax) frequency where maximum t-value is obtained and maximum t-value, [fmin fmax], frequency interval where the causal response is higher than 2, are given.
Figure 4
Figure 4
Cross-task 2D histograms for AOD versus SB fMRI activation (from Calhoun et al., 2006b). Joint 2D histograms for voxels identified in the analysis. Individual (A) and group average difference (B) histograms (with orange areas larger in controls and blue areas larger in patients) are provided along with the marginal histograms for the auditory oddball (SPM contrast image for “targets”) (C) and Sternberg (SPM contrast image for “recall”) (D) data.
Figure 5
Figure 5
Auditory oddball/gray matter jICA analysis (from Calhoun et al., 2006a). Only one component demonstrated a significant difference between patients and controls. The joint source map for the auditory oddball (A) and gray matter (B) data is presented along with the loading parameters for patients and controls (C).
Figure 6
Figure 6
ERP/fMRI jICA (from Calhoun and Adali, In Press). Joint component which showed significantly different loading parameters (p < 0.0001) for patients versus controls: (A) control (yellow) and patient (blue) average ERP plots along with the ERP part of the identified joint component (pink). (B) Thresholded fMRI part of the joint component showing bilateral temporal and frontal lobe regions.
Figure 7
Figure 7
ERP/fMRI histograms (from Calhoun and Adali, In Press). Joint histograms for patients (blue) and controls (orange).
Figure 8
Figure 8
An analysis flow chart showing the process of obtaining optimal group discriminative components (from Sui et al., 2009b). Flowchart of the optimal features/components selection, explaining how to determine the final optimal components from the raw data.
Figure 9
Figure 9
Top three optimal components and the combined most group-discriminative regions (from Sui et al., 2009b). (A,B) are the spatial maps of the top three optimal components, which are converted to Z-scores and thresholded at | Z | > 2.5; (C) shows the overlapping regions of the four features with their original spatial map values, these activated regions are important for group discrimination and may serve as potential biomarkers of schizophrenia patients; (D) displays the difference between the back-reconstructed sources (HC-SZ) on the combined highlighted regions of the top three optimal ICs in (C), the regions where HC > SZ in | Z | score are shown in orange, otherwise are shown in blue.

References

    1. Andreasen N. C., Nopoulos P., O'Leary D. S., Miller D. D., Wassink T., Flaum M. (1999). Defining the phenotype of schizophrenia: cognitive dysmetria and its neural mechanisms. Biol. Psychiatry 46, 908–92010.1016/S0006-3223(99)00152-3 - DOI - PubMed
    1. Assaf M., Jagannathan K., Calhoun V. D., Kraut M., Hart J., Pearlson G. D. (2009). Temporal sequence of hemispheric network activation during semantic processing: a functional network connectivity analysis. Brain Cogn. 70, 238–24610.1016/j.bandc.2009.02.007 - DOI - PMC - PubMed
    1. Beckmann C. F., De Luca M., Devlin J. T., Smith S. M. (2005). Investigations into resting-state connectivity using independent component analysis. Philos. Trans. R. Soc. Lond., B, Biol. Sci. 360, 1001–101310.1098/rstb.2005.1634 - DOI - PMC - PubMed
    1. Bell A. J., Sejnowski T. J. (1995). An information maximisation approach to blind separation and blind deconvolution. Neural Comput. 7, 1129–115910.1162/neco.1995.7.6.1129 - DOI - PubMed
    1. Birn R. M., Murphy K., Bandettini P. A. (2008). The effect of respiration variations on independent component analysis results of resting state functional connectivity. Hum. Brain Mapp. 29, 740–75010.1002/hbm.20577 - DOI - PMC - PubMed