. 2009 Oct;128(2):271-86.
doi: 10.1111/j.1365-2567.2009.03116.x.

Beta(2) integrin deficiency yields unconventional double-negative T cells distinct from mature classical natural killer T cells in mice

Affiliations

Beta(2) integrin deficiency yields unconventional double-negative T cells distinct from mature classical natural killer T cells in mice

Tsvetelina Oreshkova et al. Immunology. 2009 Oct.

Abstract

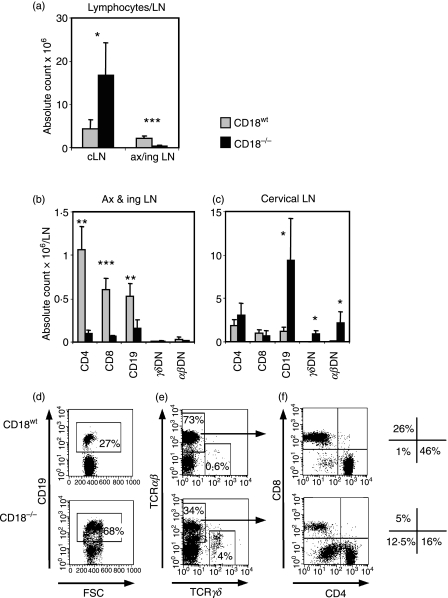
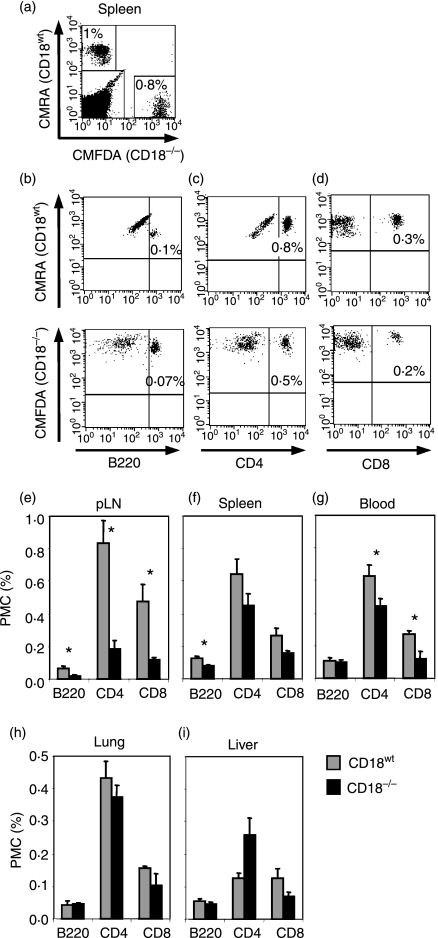
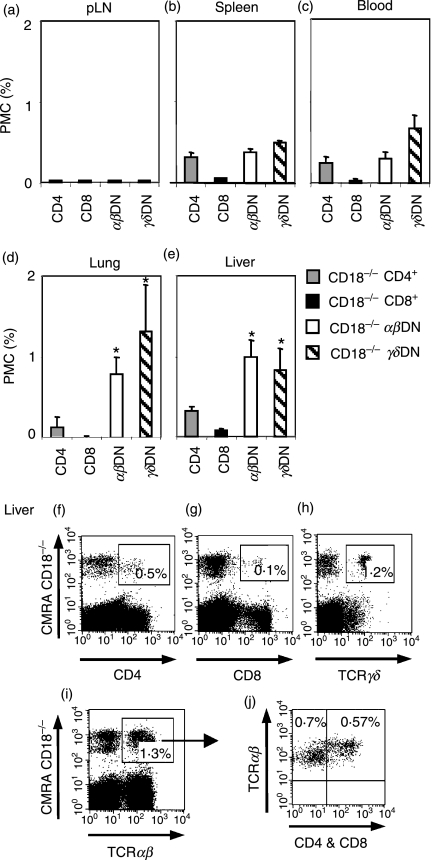
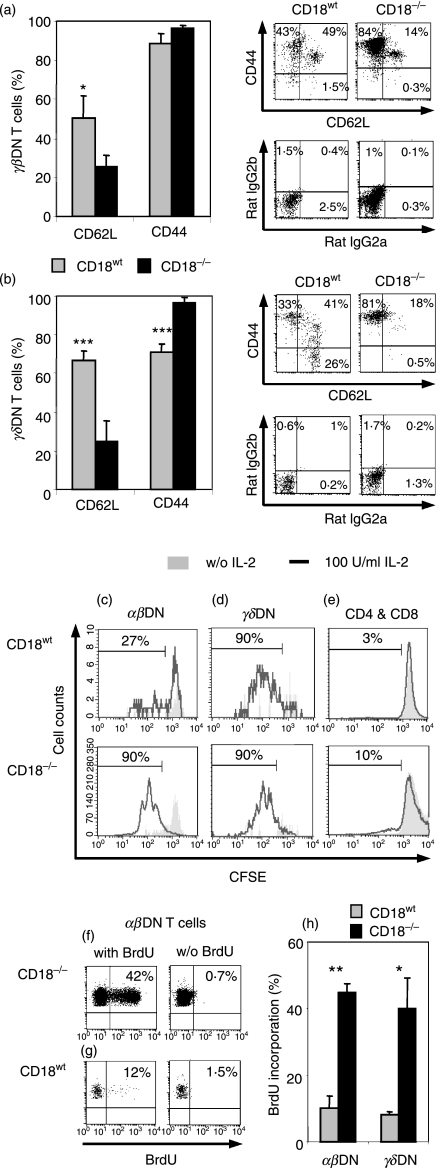
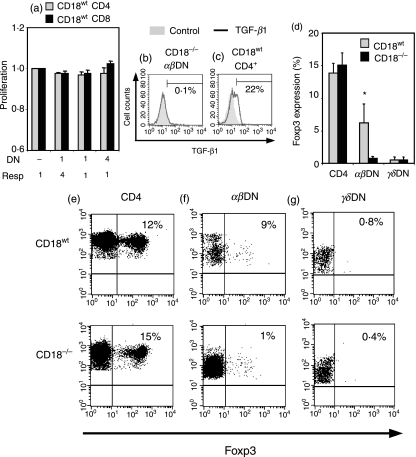
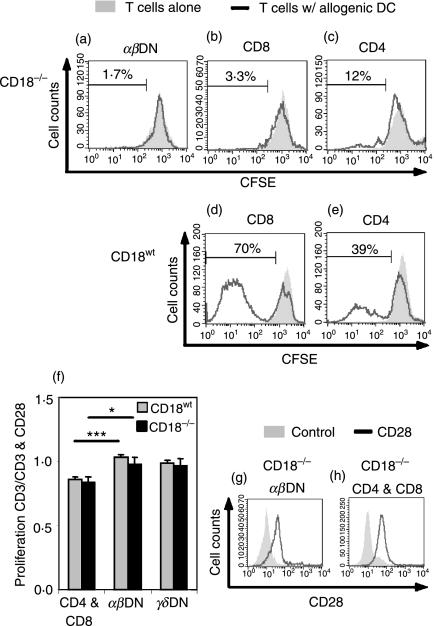
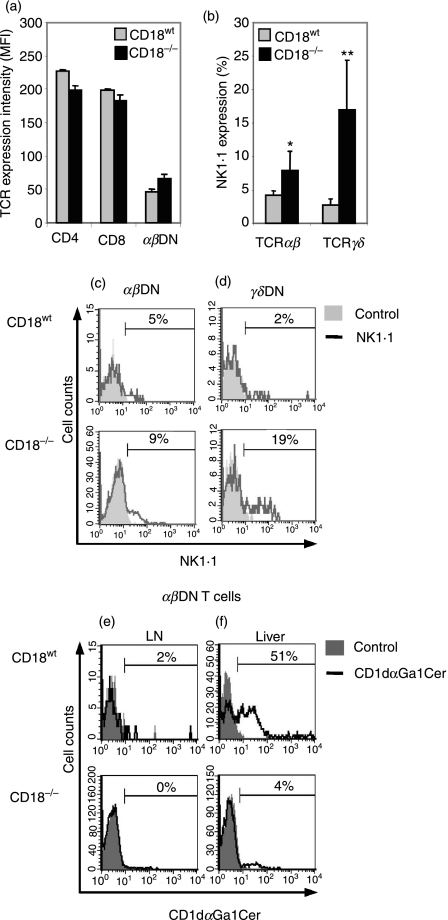
Expressed on leucocytes, beta(2) integrins (CD11/CD18) are specifically involved in leucocyte function. Using a CD18-deficient (CD18(-/-)) mouse model, we here report on their physiological role in lymphocyte differentiation and trafficking. CD18(-/-) mice present with a defect in the distribution of lymphocytes with highly reduced numbers of naïve B and T lymphocytes in inguinal and axillary lymph nodes. In contrast, cervical lymph nodes were fourfold enlarged harbouring unconventional T-cell receptor-alphabeta (TCR-alphabeta) and TCR-gammadelta CD3(+) CD4(-) CD8(-) (double-negative; DN) T cells that expanded in situ. Using adoptive transfer experiments, we found that these cells did not home to peripheral lymph nodes of CD18(wt) recipients but, like antigen-experienced T or natural killer (NK) T cells, recirculated through non-lymphoid organs. Lacking regulatory functions in vitro, CD18(-/-) TCR-alphabeta DN T cells did not suppress the proliferation of polyclonally activated CD4(+) or CD8(+) (single-positive; SP) T cells. Most interestingly, CD18(-/-) TCR-alphabeta DN T cells showed intermediate TCR expression levels, an absent activation through allogeneic major histocompatibility complex and a strong proliferative dependence on interleukin-2, hence, closely resembling NKT cells. However, our data oppose former reports, clearly showing that, because of an absent reactivity with CD1d-alphaGalCer dimers, these cells are not mature classical NKT cells. Our data indicate that CD18(-/-) TCR-alphabeta DN T cells, like NKT and TCR-gammadelta T cells, share characteristics of both adaptive and innate immune cells, and may accumulate as a compensatory mechanism to the functional defect of adaptive immunity in CD18(-/-) mice.


Figures

Figure 1
Figure 1
Cervical lymph nodes (cLN) from CD18−/− mice reveal an increase in absolute numbers of unconventional αβ or γδ double-negative (DN) T cells and B cells. (a) Cell suspensions from cervical and pooled axillary and inguinal LN were prepared from 2-month-old wild-type mice (CD18wt; grey bars, n= 5) and CD18−/− mice (black bars, n= 5). Absolute numbers of CD4+, CD8+, CD19+, αβ+ and γδ+ subpopulations were calculated using fluorescence-acitvated cell sorting analysis of pooled inguinal and axillary (ax&ing) (b) and cervical (c) LN, subsequently expressed as counts per one LN. Statistics were performed using alternate t-test: *P< 0·05, **P< 0·01 and ***P< 0·001. Representative dot plots of cLN from CD18wt and CD18−/− mice depict CD19+ cells (mostly B cells) gated on forward scatter (FSC; x-axis) versus CD19+ (y-axis) (d), γδ and αβ T cells gated on T-cell receptor (TCR) γδ (x-axis) versus TCR-αβ (y-axis) (e). As an example, total TCR-αβ+ T cells were further gated (as indicated by arrows) for CD4 (x-axis) versus CD8 (y-axis) expression (f). The resulting dot plots (f) allowed differentiation of total TCR-αβ+ T cells from CD18wt and CD18−/− mice into CD4+ (lower right quadrant), CD8+ (upper left quadrant) and αβDN T cells (lower left quadrant) (f). The corresponding percentages of T-cell subsets are shown aside. Data depict one representative out of three experiments. Data are expressed as mean ± SD.
Figure 2
Figure 2
CD18−/− B220+ lymphocytes and CD4+, CD8+ T lymphocytes reveal an impaired homing to peripheral lymph nodes (pLN) and normal recirculation to non-lymphoid organs. CD18wt (5 μm CMRA-labelled) and CD18−/− (1 μm CMFDA-labelled) lymphocytes from pLN of 4-week-old donors were cotransferred intravenously at a ratio of 1 : 1 (30 × 106 cells/mouse) into 2-month-old CD18wt recipients. Donors were chosen at a young age (i.e. 4 weeks) to obtain a maximum of naïve (CD62L+) versus antigen-experienced (CD62L) lymphocytes to be able to study lymph node homing. After 18 hr, secondary immune and non-immune organs of recipient mice (n= 3) were analysed for the presence of CD18wt (grey bars) and CD18−/− (black bars) donor cells. The cellular subtypes of transferred cells were defined after staining with CD4, CD8 and B220 monoclonal antibodies and fluorescence-activated cell sorting analysis. A representative dot plot from a spleen of a recipient mouse (a) demonstrating the percentages of CD18wt and CD18−/− transferred cells labelled with CMRA and CMFDA dye trackers, respectively. In addition, CMRA-labelled CD18wt and CMFDA-labelled CD18−/− donor cells detected in spleens of recipient mice were further differentiated into B220+ cells (b), CD4+ (c) and CD8+ (d) T cells. The upper right quadrants give the percentages of CD18wt (upper dot plots) or CD18−/− (lower dot plots) donor cells as detected in 100% of total (donor + recipient) lymphocytes. Data are representative of at least three different experiments. For quantitative assessment, results are presented in bar diagrams as percentage of total lymphocytes in LN (e), spleen (f), blood (g), lungs (h) and liver (i) of recipient mice. Significances were calculated by alternate t-test *P< 0·05.
Figure 3
Figure 3
αβ and γδ double-negative (DN) T cells from CD18−/− mice selectively accumulate in non-lymphoid organs. CD18−/− CD4+, CD8+ and unconventional αβDN and γδDN T-cell subpopulations from 8- to 10-month-old mice were compared in their ability to recirculate through secondary lymphoid and non-lymphoid organs of CD18wt recipients. In this experiment, CD18−/− mice at an age of 8–10 months were used as donors because these were richer sources of unconventional DN T cells in comparison to CD18−/− young mice. Donor lymphocytes from cervical lymph nodes (cLN) of CD18−/− mice were labelled with 5 μm cell tracker dye CMRA and intravenously injected (15 × 106 cells/mouse) into CD18wt recipients (n= 4). After 18 hr, peripheral LN (pLN) (a), spleen (b), blood (c) and the non-lymphoid organs lungs (d) and liver (e) of recipient mice were analysed for the presence of transferred CD18−/− T-cell subpopulations CD4+ (grey bars), CD8+ (black bars), αβ (white bars) and γδDN (striped bars) T cells. The detected donor cells are presented as percentages of total (donor + recipient) PMC. Significances were calculated by alternate t-test *P< 0·05. Besides, representative dot plots show CMRA-labelled CD4+ (f), CD8+ (g), γδDN (h) and total αβDN (i) T cells from pLN of CD18−/− donors as detected in livers of CD18wt recipient mice. The percentages of the respective CD18−/− CMRA-labelled donor cell subset are given in the upper right gate. Dot plot (i) depicts further gating of total αβ T cells derived from CD18−/− donors (CMRA+) and subsequent (indicated by an arrow) assessment of their expression of CD4 and CD8 in dot plot (j). The latter plot subdivides these CMRA+αβ T cells (y-axis) from CD18−/− donors into conventional (SP) T cells that express CD4 or CD8 (x-axis), both stained in the same fluorescence channel (upper right quadrant), and unconventional αβ DN T cells, staining neither for CD4 nor for CD8 (upper left quadrant). Data are representative of three different experiments.
Figure 4
Figure 4
αβ and γδ double-negative (DN) T cells from CD18−/− mice show an antigen-experienced phenotype and vigorous proliferation with interleukin-2 (IL-2). Lymphocytes from peripheral lymph nodes (pLN) from 3- to 4-month-old CD18wt (n= 4) and CD18−/− (n= 5) mice were stained for CD4, CD8, T-cell receptor (TCR) αβ, TCR-γδ, CD44, rat immunoglobulin G2b (IgG2b), CD62L and rat IgG2a monoclonal antibodies and analysed by fluorescence-activated cell sorting (FACS). For quantitative assessment, bar graphs (left column) display percentages of αβ (a) and γδDN (b) T cells from CD18wt (grey bars) and CD18−/− (black bars) expressing CD62L or CD44. Besides, dot plots (right column) give FACS stainings of αβ (a) and γδDN (b) T cells from CD18wt (left plots) and CD18−/− (right plots) for the activation markers CD62L (x-axis) and CD44 (y-axis) (upper row) compared with dot plots of isotype control staining of rat IgG2a (x-axis) and rat IgG2b (y-axis) (lower row). Significances were calculated by alternate t-test *P< 0·05, ***P< 0·001. Magnetic antibody cell sorting (MACS) sorted CD18wt (n= 4, purity > 95%) and CD18−/− (n= 5, purity > 90%) total T lymphocytes from 3- to 4-month-old mice were labelled with CFSE (5 μm) and cultured with 100 U/ml IL-2 for 4 days. Cultures with IL-2 (black line) and controls without IL-2 (filled grey) are shown as analysed by FACS. Proliferating CD18wt (upper row) and CD18−/− (lower row) αβDN (c), γδDN (d), CD4+ and CD8+ (e) T-cell subsets are also presented as percentage of total cells of the indicated subsets. Histograms are representative of three experiments. Dot plots show percentages of bromodeoxyuridine (BrdU) incorporation in αβDN T cells obtained from cervical LN of 3- to 4-month-old CD18−/− (f, left plot) and CD18wt mice (g, left plot). Controls (right plots) of CD18wt and CD18−/− mice received water without BrdU. (h) Percentage of BrdU incorporation detected in αβ and γδDN T cells from pLN of CD18wt (grey bars) and CD18−/− mice (black bars) (n= 3). Significances were calculated by alternate t-test *P< 0·05, **P< 0·01.
Figure 5
Figure 5
CD18−/−αβ double-negative (DN) T cells do not have suppressive or regulatory functions in vitro. (a) Suppressive function of in vitro expanded and sorted CD18−/−αβDN T cells (n= 3) from 4-month-old mice was assessed in cocultures with sorted, activated (5 μg/ml immobilized anti-CD3 and 2·5 μg/ml anti-CD28) CD18wt CD4+ (grey bars) or CD8+ (black bars) T cells from 2-month-old mice. All sorted subsets had a purity > 90%. CFSE (5 μm) labelled responder cells were mixed at ratios 4 : 1, 1 : 1 and 1 : 4 with CD18−/−αβDN T cells (x-axis) to obtain a total of 2 × 10⁵ cells per well in 96-well U-bottom plates. The function of effector cells (y-axis) is presented as ratio from proliferation of responder cells from cocultures versus corresponding cell number of responder cells alone. The data are representative of two experiments. (b) CD18−/−αβDN T cells (n= 3) were investigated for transofrming growth factor-β (TGF-β) production after 4 days coculture with responder cells. Fluorescence-activated cell sorting stainings for TGF-β (black line) and isotype control (filled grey) are shown. TGF-β-positive cells are given as percentage of the indicated cell subset. (c) CD18wt CD4+ cells were stimulated in vitro by iCD3 and anti-CD28 for 3 days to obtain positive controls for TGF-β staining. (d) Intracellular Foxp3 expression was measured as per cent of Foxp3-expressing CD18wt (grey bars) and CD18−/− (black bars) CD4+ SP, αβ and γδDN T cells. Four CD18wt and CD18−/− mice at an age of 2–4 months were analysed. Significances were calculated by alternate t test *P< 0·05. Representative dot plots showing intracellular Foxp3 staining (x-axis) versus CD4+ (e), TCR-αβ (f) or TCR-γδ (g) staining (y-axis). The upper right quadrant indicates percentages of Foxp3 expression in CD4+, αβDN and γδDN T cells. The upper row represents lymphocytes from CD18wt and the lower row from CD18−/− mice.
Figure 6
Figure 6
Unconventional CD18−/−αβ double-negative (DN) T cells are activated through mechanisms that deviate from conventional T cells. To investigate properties with regard to activation of CD18−/−αβDN T cells, we performed stimulation/proliferation assays using typical T-cell mitogens/stimuli. (a) Allogeneic bone marrow-derived dendritic cells (BM-DC) do not activate CD18−/−αβDN T cells. CD18−/−αβDN T cells were magnetic antibody cell-sorted, labelled with 5 μm CFSE and cultured for 6 days with previously prepared allogeneic BM-DC from BALB/c. Sorted CD18−/−αβDN T cells from 4-month-old mice were cultured alone (filled grey) or with DC at a ratio of 10 : 1 (black line) (n= 3). Control stimulations of CD18−/− and CD18wt CD8+ (b and d) and CD4+ (c and e) T cells were performed with allogeneic DC under the same conditions. (f) Full activation of αβDN T cells is independent from CD28-mediated costimulation. Total T cells from 4-month-old CD18wt (n= 4, grey bars) and CD18−/− (n= 4, black bars) peripheral lymph nodes were MACS-sorted, CFSE-labelled (5 μm) and cultured in vitro with either immobilized anti-CD3 (5 μg/ml) and anti-CD28 (2·5 μg/ml), or with immobilized anti-CD3 alone. The effect of costimulation of anti-CD28 monoclonal antibody (mAb) on proliferation of the indicated lymphocyte subsets is presented as the ratio of proliferation upon stimulation by anti-CD3 alone versus proliferation upon a combined stimulation by anti-CD3 and anti-CD28 mAb, as measured by fluorescence-activated cell sorting (FACS). A ratio of 1 indicated an equal proliferation and ratios < 1 occurred in the case that stimulation by anti-CD28 mAb further increased the anti-CD3-induced T-cell proliferation. Alternate t-test *P< 0·05, ***P< 0·001. FACS histograms show CD28 (black line) and isotype (filled grey) mAb staining of CD18−/−αβDN (g), CD4+ and CD8+ SP T cells (h). Representative data from three experiments are shown.
Figure 7
Figure 7
CD18−/−αβ double-negative (DN) T cells share common features with, but are different from natural killer (NK) T cells. (a) Lymphocytes from peripheral lymph node (pLN) from 2-month-old CD18wt (grey bars, n= 4) and CD18−/− mice (black bars, n= 4) were labelled with CD4, CD8, T-cell receptor (TCR) αβ monoclonal antibodies (mAbs). The intensity of TCR-αβ expression on indicated cellular subtypes was measured by fluorescence-activated cell sorting (FACS) and is given as mean fluorescent intensity (MFI) units. Besides, exclusively DN T cells were further investigated for the expression of distinct NKT cell markers by FACS-gating for TCR expression and absence of CD4 and CD8 (b–f). (b) Percentages of NK1.1-expressing cells from 2- to 4-month-old CD18wt and CD18−/−αβDN (n= 5) and γδDN T (n= 6) subsets are depicted. Significances were calculated by alternate t-test *P< 0·05, **P< 0·01. Representative histograms for NK1.1 expression by αβDN (c) and γδDN T cells (d) from CD18wt (upper row) and CD18−/− mice (lower row) are shown. Percentages represent NK1.1-expressing cells (black line), which are overlaid on control labelling with rat IgG2a (filled grey). αβDN T cells from pLN (e) of 2- to 4-month-old CD18wt (upper row, n= 4) and CD18−/− (lower row, n= 5) mice were investigated for invariant NKT-specific T-cell receptor reactivity using CD1d loaded with αGalCer dimers (black line) as compared with control staining (filled grey). αβDN T cells from livers (f) of the same mice, particularly of CD18wt mice, served as positive controls for CD1d-αGalCer dimer loading, and reflect the population of invariant NKT cells among the αβDN T cells. Percentages of dimer-reactive αβDN T cells are shown. Dot plots are representative of two experiments.

Similar articles

Cited by

References

    1. Yong K, Khwaja A. Leucocyte cellular adhesion molecules. Blood Rev. 1990;4:211–25. - PubMed
    1. Arnaout MA. Structure and function of the leukocyte adhesion molecules CD11/CD18. Blood. 1990;75:1037–50. - PubMed
    1. Berlin-Rufenach C, Otto F, Mathies M, Westermann J, Owen MJ, Hamann A, Hogg N. Lymphocyte migration in lymphocyte function-associated antigen (LFA)-1-deficient mice. J Exp Med. 1999;189:1467–78. - PMC - PubMed
    1. Hamann A, Jablonski-Westrich D, Duijvestijn A, Butcher EC, Baisch H, Harder R, Thiele HG. Evidence for an accessory role of LFA-1 in lymphocyte-high endothelium interaction during homing. J Immunol. 1988;140:693–9. - PubMed
    1. Anderson DC, Springer TA. Leukocyte adhesion deficiency: an inherited defect in the Mac-1, LFA-1, and p150,95 glycoproteins. Annu Rev Med. 1987;38:175–94. - PubMed

Publication types

MeSH terms

Substances

LinkOut - more resources