. 2009 Oct;119(10):3011-23.
doi: 10.1172/JCI39065. Epub 2009 Sep 8.

The tumor-promoting actions of TNF-alpha involve TNFR1 and IL-17 in ovarian cancer in mice and humans

Affiliations

The tumor-promoting actions of TNF-alpha involve TNFR1 and IL-17 in ovarian cancer in mice and humans

Kellie A Charles et al. J Clin Invest. 2009 Oct.

Abstract

Cytokines orchestrate the tumor-promoting interplay between malignant cells and the immune system. In many experimental and human cancers, the cytokine TNF-alpha is an important component of this interplay, but its effects are pleiotropic and therefore remain to be completely defined. Using a mouse model of ovarian cancer in which either TNF receptor 1 (TNFR1) signaling was manipulated in different leukocyte populations or TNF-alpha was neutralized by antibody treatment, we found that this inflammatory cytokine maintained TNFR1-dependent IL-17 production by CD4+ cells and that this led to myeloid cell recruitment into the tumor microenvironment and enhanced tumor growth. Consistent with this, in patients with advanced cancer, treatment with the TNF-alpha-specific antibody infliximab substantially reduced plasma IL-17 levels. Furthermore, expression of IL-1R and IL-23R was downregulated in CD4+CD25- cells isolated from ascites of ovarian cancer patients treated with infliximab. We have also shown that genes ascribed to the Th17 pathway map closely with the TNF-alpha signaling pathway in ovarian cancer biopsy samples, showing particularly high levels of expression of genes encoding IL-23, components of the NF-kappaB system, TGF-beta1, and proteins involved in neutrophil activation. We conclude that chronic production of TNF-alpha in the tumor microenvironment increases myeloid cell recruitment in an IL-17-dependent manner that contributes to the tumor-promoting action of this proinflammatory cytokine.


Figures

Figure 1
Figure 1. Disease stabilization in TNFR1 bone marrow chimeras.
(A) TNFR1–/– bone marrow, WT bone marrow, and reverse (WT bone marrow in TNFR1–/– mice) chimeras were i.p. injected with 107 ID8 cells/mouse. Tumor burden was monitored weekly in situ by bioluminescence. TNFR1–/– bone marrow chimeras had significantly lower disease burden, starting 4 weeks after tumor cell injection (P < 0.01). Data are represented as mean ± SEM of n = 12. Representative data are shown from 2 independent experiments. (B) Total cell counts in the malignant ascites at week 8. Cytospins were prepared from ascitic fluid, and cells were differentiated with Wright’s staining. TNFR1–/– bone marrow chimeras had a significantly lower neutrophil infiltrate in the peritoneal cavity (P < 0.05, n = 12). Data are represented as mean ± SD of n = 12. Representative data are shown from 2 independent experiments. Data for WT (control mice, no chimeras) and reverse chimeras are shown in Supplemental Figure 1. (C) FACS analysis of the ascitic leukocyte infiltrate. TNFR1–/– bone marrow chimeras had significantly fewer infiltrating Gr-1+ F4/80 neutrophils (P < 0.01, n = 6). Data are represented as percentage of the CD45+ population, including mean of n = 6. Representative data are shown from 2 independent experiments (week 8). (D) WT mice were injected with 107 ID8-luc cells i.p.; Gr-1–neutralizing antibody or IgG control antibody were commenced twice weekly i.p. (100 μg/mouse). Data are represented as mean + SEM of n = 6. Representative data are shown from 2 independent experiments (week 8).
Figure 2
Figure 2. Tissue-specific reconstitution of TNFR1.
Data are represented as mean ± SEM of n = 6. TNFR1flcneo mice had significantly lowered disease burden (P < 0.01) compared with WT mice. (A) TNFR1 gain of function in the monocyte/macrophage lineage has (TNFR1DLysM) no effect on tumor growth. (B) TNFR1 gain of function in CD19+ cells (TNFR1ΔCD19) has no effect on tumor growth. (C) Gain of function of TNFR1 in the CD4 lineage of TNFR1ΔCD4 mice “rescued” the protective effect of TNFR1 depletion. (D) Western blot for TNFR1 on protein lysates from CD4+ cells shows knockin of TNFR1 in CD4+ cells of TNFR1ΔCD4+ mice but not CD19+ or CD11b+ cells. (E) ID8 tumor–bearing TNFR1flcneo mice have significantly fewer neutrophils in the malignant ascitic fluid (P < 0.05; compared with WT mice). This effect is reversed in TNFR1ΔCD4 mice (P < 0.05; compared with TNFR1flcneo). Data are represented as mean ± SD of n = 6. (F) FACS analysis of the ascitic CD4+ population. TNFR1flcneo tumor-bearing mice have significantly fewer ascitic Th17 cells (P < 0.01, n = 6) compared with WT and TNFR1ΔCD4 mice. (G) IL-17 mRNA expression in CD4+ cells isolated from ascites of tumor–bearing mice at 8 weeks. (H) Ascitic CD4+ cells were selected and pooled (n = 3) and ex vivo stimulated with PMA and ionomycin for 4 hours. CD4+ cells from TNFR1–/– chimeras or TNFR1flcneo mice secreted significantly lower amounts of IL-17 (P < 0.01). Data are represented as mean ± SD of n = 6. Representative data are shown from 2 independent experiments.
Figure 3
Figure 3. Analysis of cytokine expression during tumor progression in tumor-bearing mice at 4, 6, and 8 weeks.
Mice were sacrificed and bled for plasma collection. (A) IL-6 analysis. (B) IL-17 analysis. Analysis showed no baseline difference (in non–tumor-bearing mice) for any of the analyzed cytokines (white bars in the 4-week graph). IL-6 and IL-17 levels are significantly lower in ID8 tumor–bearing mice 6 and 8 weeks after ID8 cell injection (P < 0.01, n = 6). Data are represented as mean + SD of n = 6. Representative data are shown from 2 independent experiments.
Figure 4
Figure 4. Increased IL-17–dependent neutrophil recruitment.
(A) Recombinant IL-17 rescued the antitumor effect in TNFR1flcneo mice (P < 0.01). Data are represented as mean ± SEM of n = 6. Representative data are shown from 2 independent experiments. The right-hand graph demonstrates the curves for only TNFR1cneo mice with or without recombinant IL-17. (B) Total cell counts of the leukocyte infiltrate in the malignant ascites at week 8 (after i.p. injection). Control (left): significantly lower neutrophils in TNFR1flcneo ID8 tumor–bearing mice compared with WT mice (P < 0.01). Treatment with recombinant murine IL-17A (0.5 μg/mouse/week; right): recombinant IL-17A rescued neutrophil infiltration in TNFR1flcneo ID8 tumor–bearing mice. Data are represented as mean + SD of n = 6. Representative data are shown from 2 independent experiments.
Figure 5
Figure 5. In vivo treatment with murine anti–TNF-α in a preclinical model of stage 4 ovarian cancer.
(A) Neutralizing TNF-α antibody (50 μg/mouse) administered twice weekly led to disease stabilization in ID8 tumor–bearing mice (P < 0.01). Data are represented as mean ± SEM of n = 10. (B) IL-17 plasma and ascites levels (8-week time point). Anti–TNF-α–treated mice had significantly lower IL-17 levels (P < 0.01). Data are represented as mean ± SD of n = 10. (C) Ascitic leukocyte infiltration. Within the ascitic fluid of anti–TNF-α–treated mice were significantly fewer neutrophils (P < 0.05; anti–TNF-α vs. IgG control, anti–TNF-α vs. PBS). Data are represented as mean + SD of n = 10. (D) FACS analysis of the CD4+ subpopulation within ID8 tumor–bearing mice. Anti–TNF-α treatment led to a significant reduction in the CD4+IL-17+IFNγ population compared with control IgG- or PBS-treated mice. Data are represented as mean + SD of n = 10. (E) FACS analysis of the Gr-1+ F4/80 population in the ascitic fluid. Significant reduction of neutrophils in the anti–TNF-α–treated group. Data are represented as percentage of the CD45+ population including mean ± SD of n = 10. (F) Neutralizing IL-17A antibody (100 μg/mouse) administered twice weekly led to neutrophil depletion (insert) and disease stabilization in ID8 tumor–bearing mice (P < 0.01). Data are represented as mean ± SEM of n = 10. Representative data are shown from 2 independent experiments.
Figure 6
Figure 6. Patients with advanced malignancies treated with anti–TNF-α in phase I clinical trial.
(A) 40 patients with a variety of malignancies were treated in a phase I/II clinical trial with infliximab (36). Plasma analysis before and 24 hours after treatment with infliximab demonstrated that anti–TNF-α significantly reduced the plasma levels of IL-17 (P < 0.05). Data are represented as mean ± SD of n = 40. (B) Analysis of IL-17 levels in stable (SD) versus progressive disease (PD) patients (P < 0.05). In both groups, IL-17 levels dropped significantly 24 hours after anti–TNF-α treatment. Data are represented as mean ± SD of n = 40. (C) Cytokine release assay: whole-blood samples were collected from patients in the presence of PHA. IL-17 release was significantly lower 24 hours after anti–TNF-α treatment (P < 0.05). Similar results were obtained for D. IL-6 (P < 0.05).
Figure 7
Figure 7. Ovarian cancer patients with advanced disease treated with infliximab in a phase I/II clinical trial.
Seventeen patients with advanced ovarian cancer received i.v. anti–TNF-α treatment in this clinical study. (A) TNF-α concentrations (P < 0.05) were significantly lower at 1 hour (serum) and 24 hours (ascitic fluid) after infliximab infusion. Data are presented as mean ± SD of n = 17. (B) IL-17 protein levels were significantly reduced in the ascitic fluid 24 hours after infliximab infusion (P < 0.05); however, there was no difference in IL-17 plasma levels. Data are represented as mean ± SD of n = 15. (C) TNF-α real-time analysis of ascitic cell total RNA. TNF-α gene expression was significantly reduced 24 hours after anti–TNF-α treatment (P < 0.01). Data are represented as mean ± SD of n = 15. (D) IL-17 real-time analysis of ascitic cell total RNA. IL-17 gene expression was significantly reduced 24 hours after anti–TNF-α treatment (P < 0.01). Data are represented as mean ± SD of n = 15. (E and F) Cytokine release assay: whole-blood samples were collected from patients in the presence of PHA. Cytokine release was measured by ELISA. IL-17 release was significantly lower 24 hours after anti–TNF-α treatment (E; P < 0.05); similar results were obtained for IL-6 (F; P < 0.05). (G) CD4+CD25 cells were purified by FACS sorting following MACS bead isolation from ascites samples before treatment and 24 hours after infliximab infusion. Control naive CD4+CD25 T cells were selected from peripheral blood of healthy blood donors. Data are represented as mean + SD of n = 10; *P < 0.01.
Figure 8
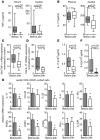
Figure 8. Gene array analysis.
285 samples of ovarian cancer data sets were ranked from low to high levels of gene expression in the TNF signaling pathway. The 50 samples with the highest expression of genes in this individual pathway and 50 samples with the lowest expression of these genes were analyzed. Network objects (or genes) that make up the pathway “cytokine production in Th17 cells” are represented as a heat map.

References

    1. Mantovani A., Allavena P., Sica A., Balkwill F. Cancer-related inflammation. Nature. 2008;454:436–444. doi: 10.1038/nature07205. - DOI - PubMed
    1. McInnes I.B., Schett G. Cytokines in the pathogenesis of rheumatoid arthritis. Nat. Rev. Immunol. 2007;7:429–442. doi: 10.1038/nri2094. - DOI - PubMed
    1. Balkwill F. TNF-alpha in promotion and progression of cancer. Cancer Metastasis Rev. 2006;25:409–416. doi: 10.1007/s10555-006-9005-3. - DOI - PubMed
    1. Hodge D.R., Hurt E.M., Farrar W.L. The role of IL-6 and STAT3 in inflammation and cancer. Eur. J. Cancer. 2005;41:2502–2512. doi: 10.1016/j.ejca.2005.08.016. - DOI - PubMed
    1. Naugler W.E., et al. Gender disparity in liver cancer due to sex differences in MyD88-dependent IL-6 production. Science. 2007;317:121–124. doi: 10.1126/science.1140485. - DOI - PubMed

Publication types

MeSH terms