. 2009 Nov;47(5):664-75.
doi: 10.1016/j.yjmcc.2009.08.028. Epub 2009 Sep 8.

Interaction of myocardial insulin receptor and IGF receptor signaling in exercise-induced cardiac hypertrophy

Affiliations

Interaction of myocardial insulin receptor and IGF receptor signaling in exercise-induced cardiac hypertrophy

Hiroyuki Ikeda et al. J Mol Cell Cardiol. 2009 Nov.

Abstract

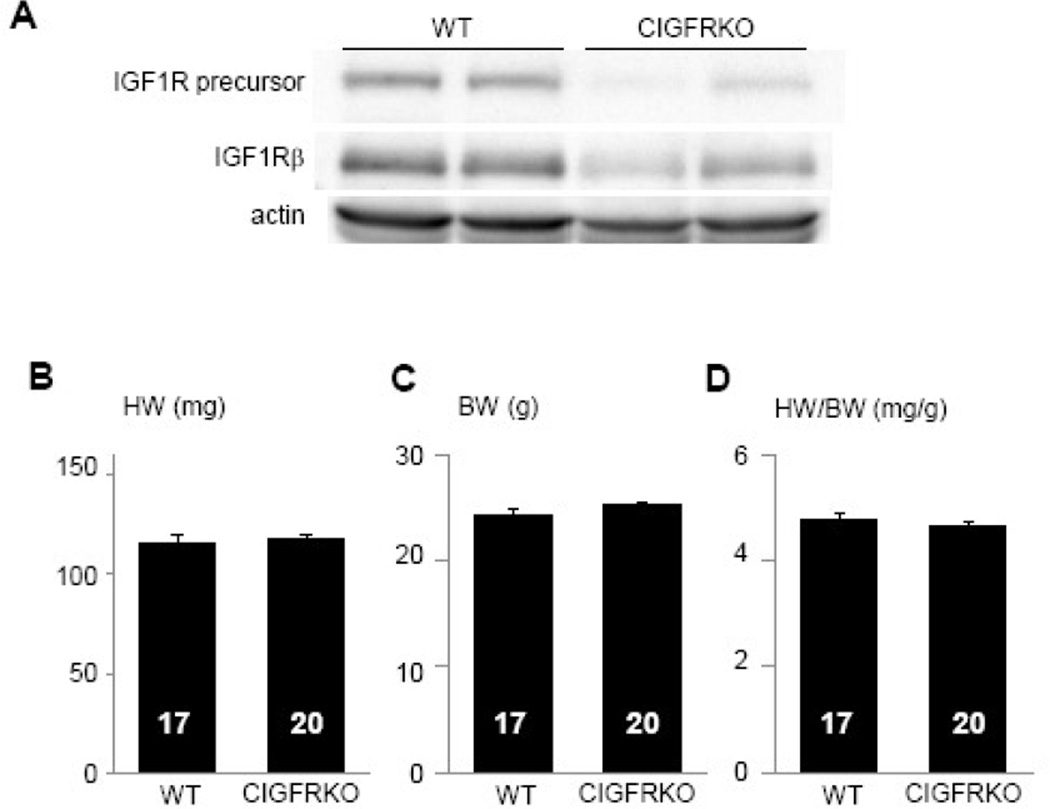
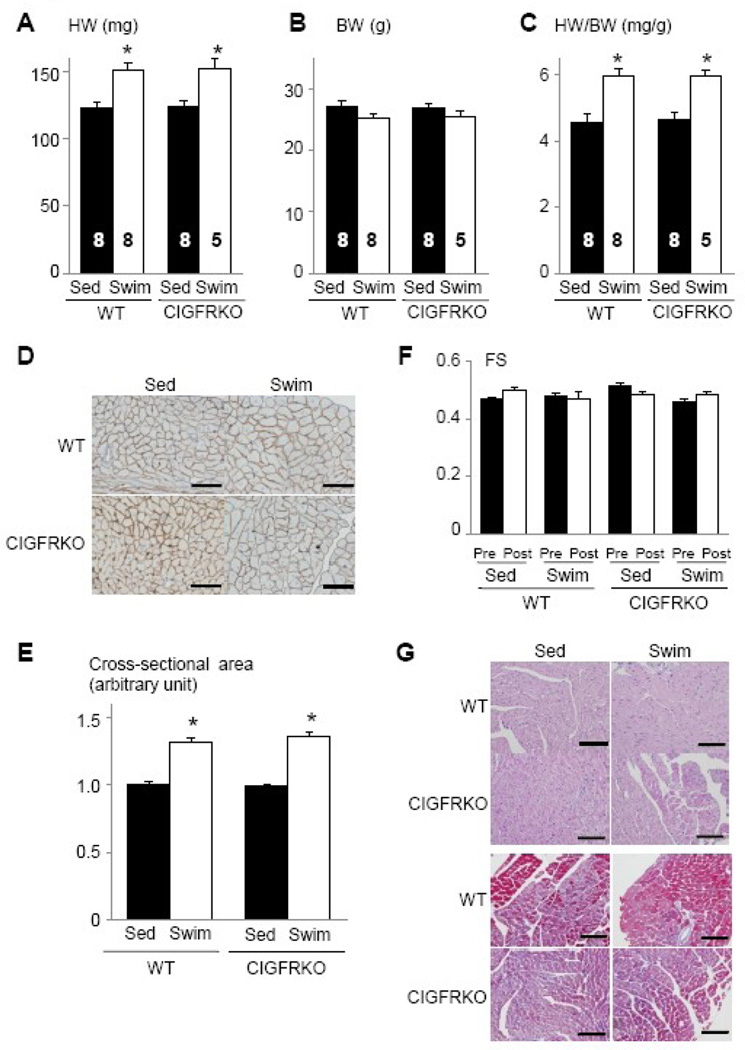
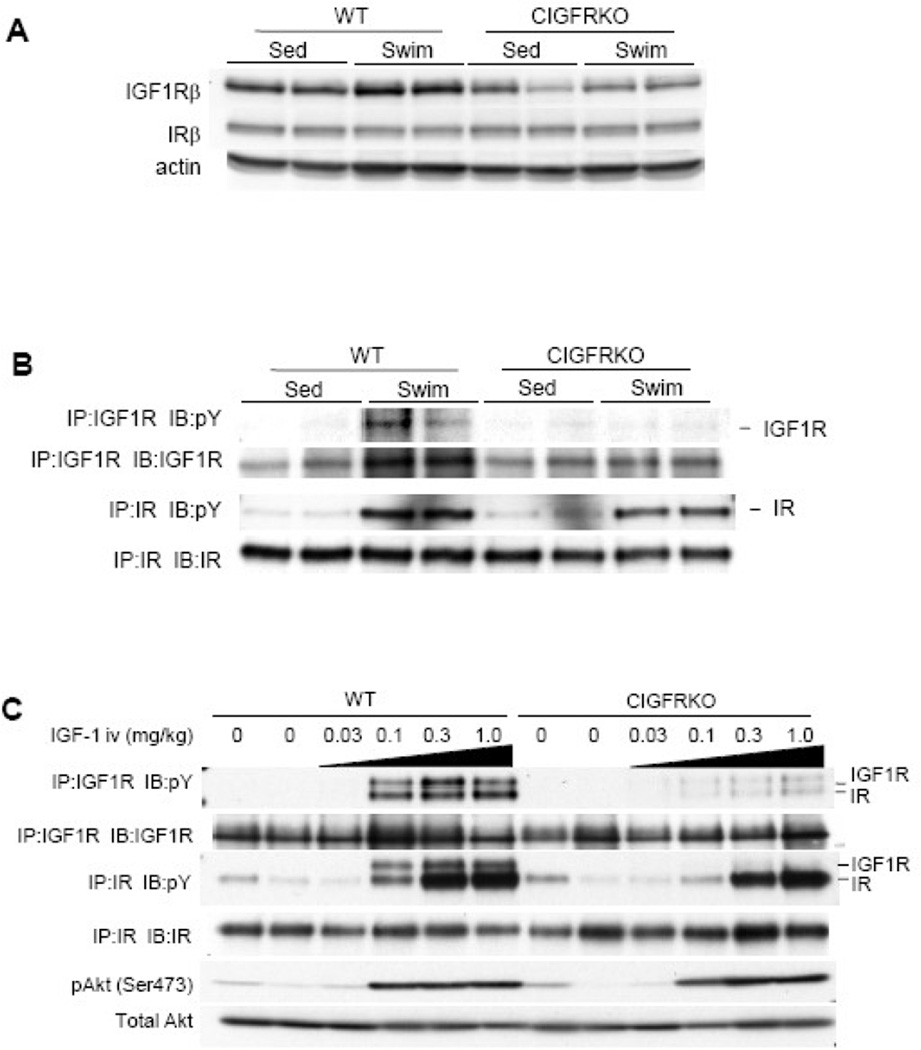
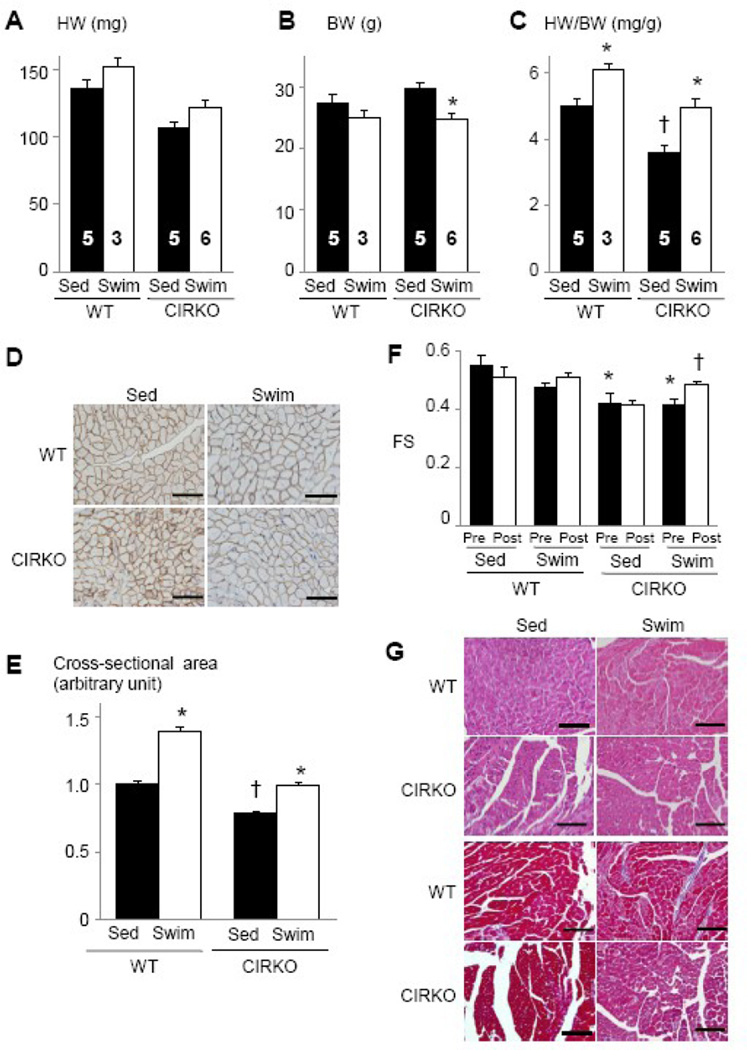
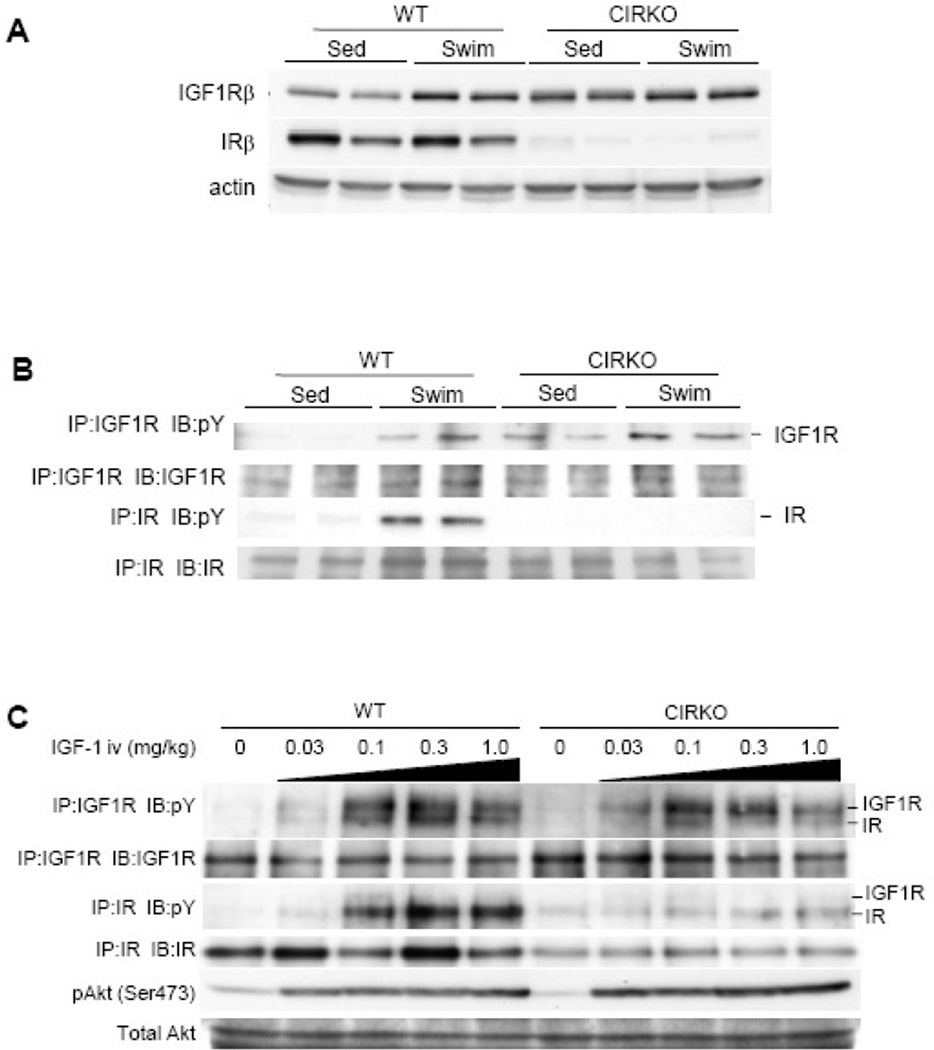
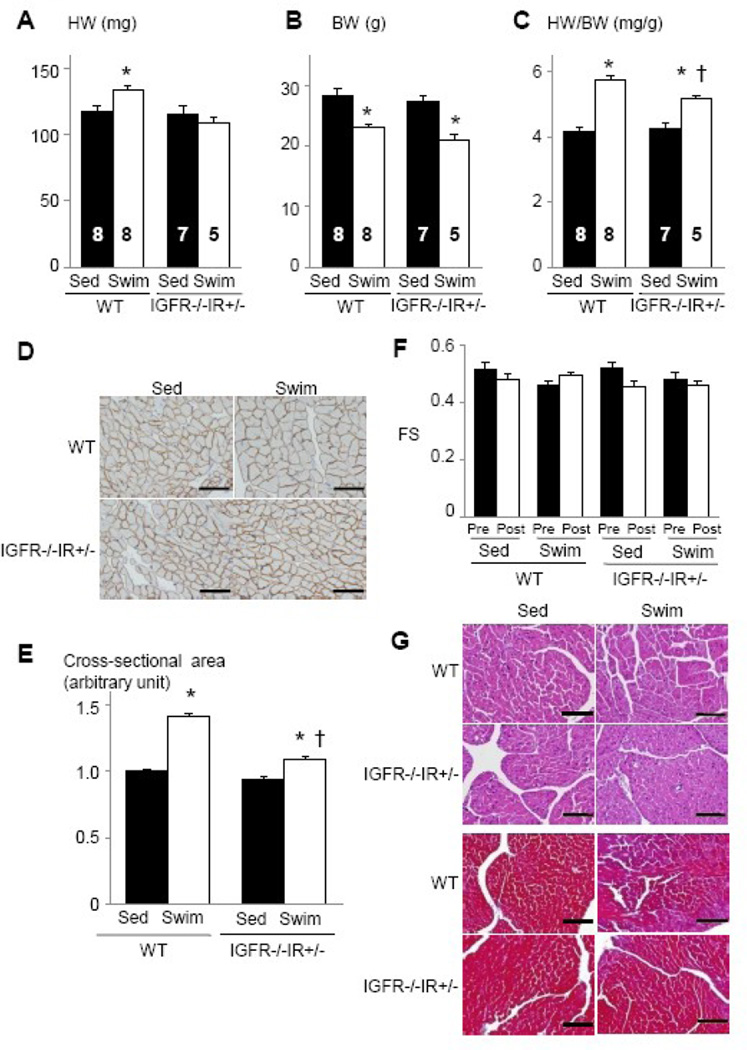
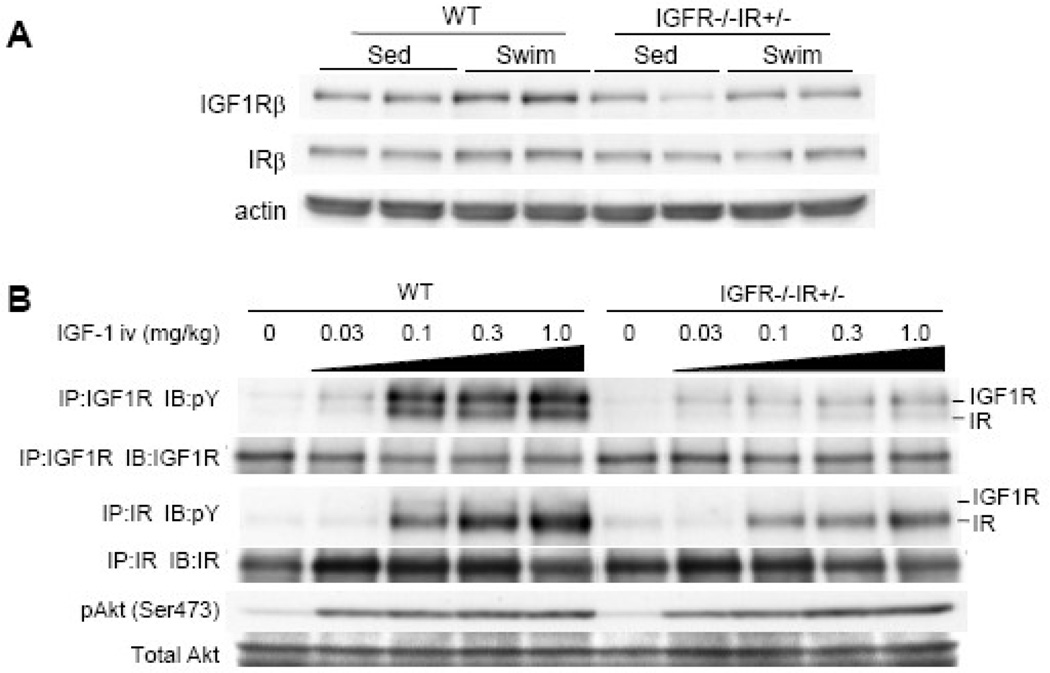
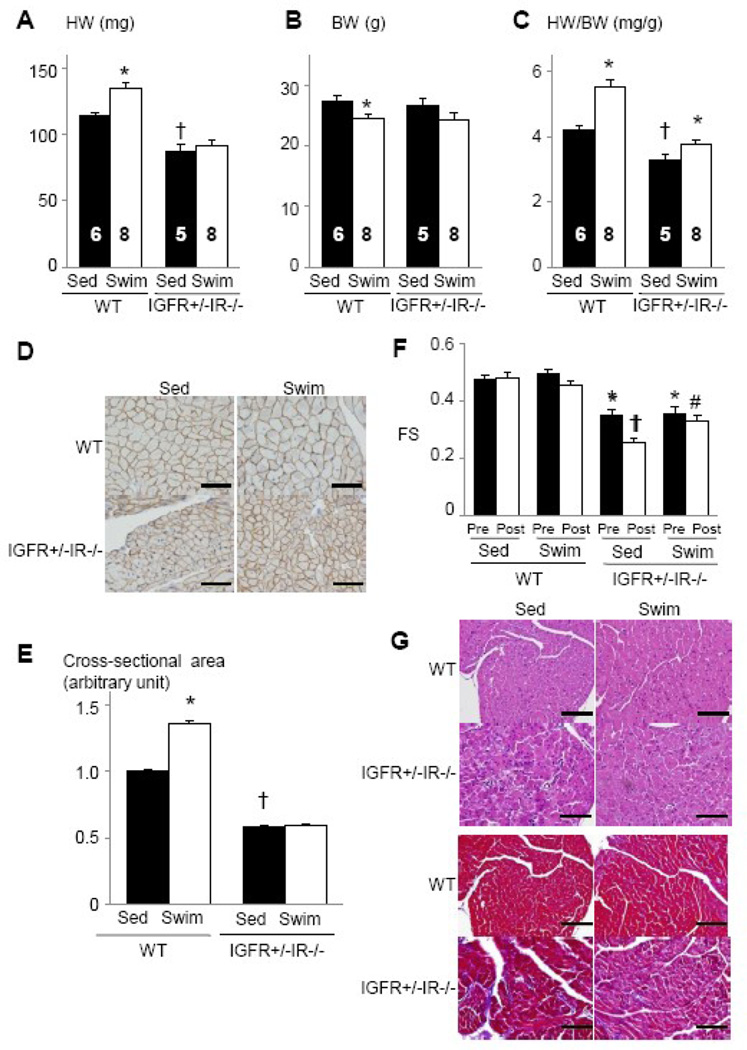
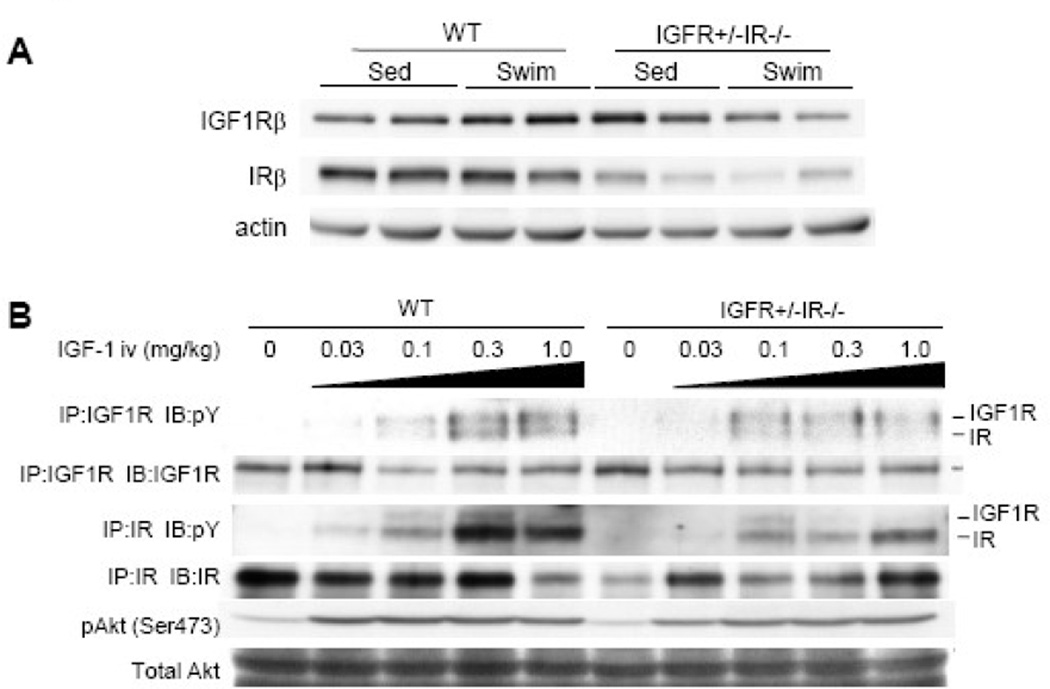
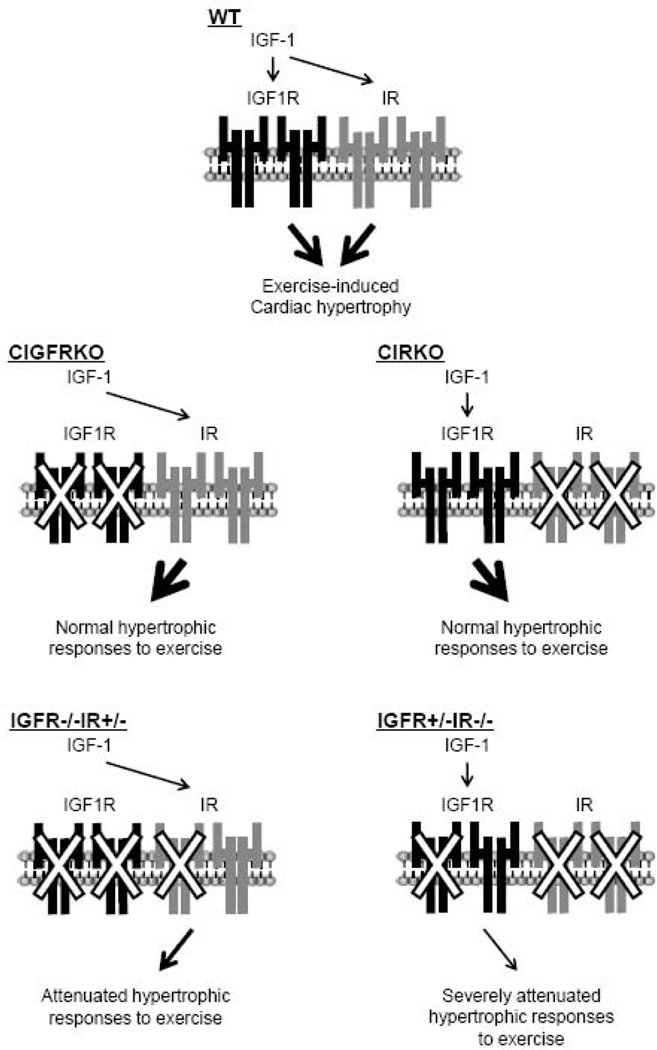
Insulin-like growth factor-1 (IGF-1) signaling has recently been implicated in the development of cardiac hypertrophy after long-term endurance training, via mechanisms that may involve energetic stress. Given the potential overlap of insulin and IGF-1 signaling we sought to determine if both signaling pathways could contribute to exercise-induced cardiac hypertrophy following shorter-term exercise training. Studies were performed in mice with cardiac-specific IGF-1 receptor (IGF1R) knockout (CIGFRKO), mice with cardiac-specific insulin receptor (IR) knockout (CIRKO), CIGFRKO mice that lacked one IR allele in cardiomyocytes (IGFR-/-IR+/-), and CIRKO mice that lacked one IGF1R allele in cardiomyocytes (IGFR+/-IR-/-). Intravenous administration of IGF-1 or 75 hours of swimming over 4 weeks increased IGF1R tyrosine phosphorylation in the heart in control and CIRKO mice but not in CIGFRKO mice. Intriguingly, IR tyrosine phosphorylation in the heart was also increased following IGF-1 administration or exercise training in control and CIGFRKO mice but not in CIRKO mice. The extent of cardiac hypertrophy following exercise training in CIGFRKO and CIRKO mice was comparable to that in control mice. In contrast, exercise-induced cardiac hypertrophy was significantly attenuated in IGFR-/-IR+/- and IGFR+/-IR-/- mice. Thus, IGF-1 and exercise activates both IGF1R and IR in the heart, and IGF1R- and IR-mediated signals may serve redundant roles in the hypertrophic responses of the heart to exercise training.


Figures

Fig. 1
Fig. 1. CIGFRKO mice exhibit no obvious cardiac phenotype at baseline
(A) Expression of IGF1R precursor protein and IGF1R β subunit protein (IGF1Rβ) as revealed by western blot analysis of whole heart lysates. Actin served as internal control. (B–D) HW (B), BW (C), and HW/BW ratio (D) of WT and CIGFRKO mice at 10 weeks of age. The number of mice analyzed is shown in the bar.
Fig. 2
Fig. 2. CIGFRKO mice develop physiological cardiac hypertrophy in response to exercise training
(A–C) HW (A), BW (B), and HW/BW ratio (C) of WT and CIGFRKO mice. *p < 0.05 versus Sed group of the same genotype. The number of mice analyzed is shown in the bar. (D) Immunohistochemistry with anti-dystrophin antibody. Scale bar=50µm. (E) Myocyte cross-sectional area of WT and CIGFRKO mice. *p < 0.05 versus Sed group of the same genotype. (F) Left ventricular contractile function as assessed by echocardiographic measurement of fractional shortening (FS). Pre and Post represent before and after exercise, respectively. (G) Histological analysis with HE (upper panel) and Masson’s trichrome (MT) (lower panel) staining. Scale bar=100µm. Sed and Swim represent a sedentary and a swimming group, respectively.
Fig. 3
Fig. 3. Western Blot analysis of CIGFRKO heart extracts after exercise or IGF-I administration
(A) Expression of IGF1R β subunit protein (IGF1Rβ) and IR β subunit protein (IRβ) in the heart of WT and CIGFRKO mice. Sed and Swim represent a sedentary and a swimming group, respectively. (B) Tyrosine phosphorylation levels of IGF1R and IR following exercise training. pY represents anti-phosphotyrosine antibody. IP and IB represent immunoprecipitation and immunoblot, respectively. (C) Tyrosine phosphorylation levels of IGF1R/IR and activation of Akt in the heart of WT and CIGFRKO mice 5 minutes after IGF-1 administration. There are some IGF1R bands in the immunoprecipitates of IR and vice versa, possibly due to antibody cross-reactivity. pY represents anti-phosphotyrosine antibody. IP and IB represent immunoprecipitation and immunoblot, respectively.
Fig. 4
Fig. 4. CIRKO mice develop physiological cardiac hypertrophy in response to exercise training
(A–C) HW (A), BW (B), and HW/BW ratio (C) of WT and CIRKO mice. *p < 0.05 versus Sed group of the same genotype, †p < 0.05 versus WT Sed group. The number of mice analyzed is shown in the bar. (D) Immunohistochemistry with anti-dystrophin antibody. Scale bar=50µm. (E) Myocyte cross-sectional area of WT and CIRKO mice. *p < 0.05 versus Sed group of the same genotype. †p < 0.05 versus WT Sed group. (F) Left ventricular contractile function as assessed by echocardiographic measurement of fractional shortening (FS). Pre and Post represent before and after exercise, respectively. *p < 0.05 versus WT Sed Pre group, †p < 0.05 versus CIRKO Swim Pre group. (G) Histological analysis with HE (upper panel) and Masson’s trichrome (MT) (lower panel) staining. Scale bar=100µm. Sed and Swim represent a sedentary and a swimming group, respectively.
Fig. 5
Fig. 5. Western Blot analysis of CIRKO heart extracts after exercise or IGF-1 administration
(A) Expression of IGF1R β subunit protein (IGF1Rβ) and IR β subunit protein (IRβ) in the heart of WT and CIRKO mice. Sed and Swim represent a sedentary and a swimming group, respectively. (B) Tyrosine phosphorylation levels of IGF1R an IR following exercise training. pY represents anti-phosphotyrosine antibody. IP and IB represent immunoprecipitation and immunoblot, respectively. (C) Tyrosine phosphorylation levels of IGF1R/IR and activation of Akt in the heart of WT and CIRKO mice 5 minutes after IGF-1 administration. There are some IGF1R bands in the immunoprecipitates of IR and vice versa, possibly due to antibody cross-reactivity. pY represents anti-phosphotyrosine antibody. IP and IB represent immunoprecipitation and immunoblot, respectively.
Fig. 6
Fig. 6. Exercise-induced physiological cardiac hypertrophy is attenuated in IGF1R−/−IR+/− mice
(A–C) HW (A), BW (B), and HW/BW ratio (C) of WT and IGF1R−/−IR+/− mice. *p < 0.05 versus Sed group of the same genotype, †p < 0.05 versus WT Swim group. The number of mice analyzed is shown in the bar. (D) Immunohistochemistry with anti-dystrophin antibody. Scale bar=50µm. (E) Myocyte cross-sectional area of WT and IGF1R−/−IR+/− mice. *p < 0.05 versus Sed group of the same genotype. †p < 0.05 versus WT Swim group. (F) Left ventricular contractile function as assessed by echocardiographic measurement of fractional shortening (FS). Pre and Post represent before and after exercise, respectively. (G) Histological analysis with HE (upper panel) and Masson’s trichrome (MT) (lower panel) staining. Scale bar=100µm. Sed and Swim represent a sedentary and a swimming group, respectively.
Fig. 7
Fig. 7. Western Blot analysis of IGF1R−/−IR+/− heart extracts after exercise or IGF-1 administration
(A) Expression of IGF1R β subunit protein (IGF1Rβ) and IR β subunit protein (IRβ) in the heart of WT and IGF1R−/−IR+/− mice. Sed and Swim represent a sedentary and a swimming group, respectively. (B) Tyrosine phosphorylation levels of IGF1R/IR and activation of Akt in the heart of WT and IGF1R−/−IR+/− mice 5 minutes after IGF-1 administration. There are some IGF1R bands in the immunoprecipitates of IR and vice versa, possibly due to antibody cross-reactivity. pY represents anti-phosphotyrosine antibody. IP and IB represent immunoprecipitation and immunoblot, respectively.
Fig. 8
Fig. 8. Exercise-induced physiological cardiac hypertrophy is attenuated in IGF1R+/−IR−/− mice
(A–C) HW (A), BW (B), and HW/BW ratio (C) of WT and IGF1R+/−IR−/− mice. *p < 0.05 versus Sed group of the same genotype, †p < 0.05 versus WT Sed group. The number of mice analyzed is shown in the bar. (D) Immunohistochemistry with anti-dystrophin antibody. Scale bar=50µm. (E) Myocyte cross-sectional area of WT and IGF1R+/−IR−/− mice. *p < 0.05 versus WT Sed group. †p < 0.05 versus WT Sed group. (F) Left ventricular contractile function as assessed by echocardiographic measurement of fractional shortening (FS). Pre and Post represent before and after exercise, respectively. *p < 0.05 versus WT Sed Pre group, †p < 0.05 versus IGF1R+/−IR−/− Sed Pre group, #p < 0.05 versus IGF1R+/−IR−/− Sed Post group. (G) Histological analysis with HE (upper panel) and Masson’s trichrome (MT) (lower panel) staining. Scale bar=100µm. Sed and Swim represent a sedentary and a swimming group, respectively.
Fig. 9
Fig. 9. Western Blot analysis of IGF1R+/−IR−/− heart extracts after exercise or IGF-1 administration
(A) Expression of IGF1R β subunit protein (IGF1Rβ) and IR β subunit protein (IRβ) in the heart of WT and IGF1R+/−IR−/− mice. Sed and Swim represent a sedentary and a swimming group, respectively. (B) Tyrosine phosphorylation levels of IGF1R/IR and activation of Akt in the heart of WT and IGF1R+/−IR−/− mice 5 minutes after IGF-1 administration. There are some IGF1R bands in the immunoprecipitates of IR and vice versa, possibly due to antibody cross-reactivity. pY represents anti-phosphotyrosine antibody. IP and IB represent immunoprecipitation and immunoblot, respectively.
Fig. 10
Fig. 10. Schematic illustration of the interaction and crosstalk between IGF1R-and IR-mediated signals in exercise-induced cardiac hypertrophy
IGF-1 activates both IGF1R and IR in the heart in response to exercise training. Exercise-induced cardiac hypertrophy develops normally in CIGFRKO mice and CIRKO mice, although combined deletion of two Igf1r alleles and one Ir allele or one Igf1r allele and two Ir alleles results in the attenuation of exercise-induced hypertrophy. Thus, exercise-induced cardiac hypertrophy is mediated both by IGF1R- and IR-mediated signals in a redundant fashion. IGF-1 appears to be a major factor that activates both IGF1R and IR. The contribution of insulin in exercise-induced cardiac hypertrophy is not clear from our present study.

References

    1. Pasumarthi KB, Field LJ. Cardiomyocyte cell cycle regulation. Circ Res. 2002;90:1044–1054. - PubMed
    1. Olson EN, Schneider MD. Sizing up the heart: development redux in disease. Genes Dev. 2003;17:1937–1956. - PubMed
    1. Richey PA, Brown SP. Pathological versus physiological left ventricular hypertrophy: a review. J Sports Sci. 1998;16:129–141. - PubMed
    1. Heineke J, Molkentin JD. Regulation of cardiac hypertrophy by intracellular signalling pathways. Nat Rev Mol Cell Biol. 2006;7:589–600. - PubMed
    1. Coats AJ. Exercise training for heart failure: coming of age. Circulation. 1999;99:1138–1140. - PubMed

Publication types

MeSH terms