. 2009 Dec;116(12):2305-14.e1-2.
doi: 10.1016/j.ophtha.2009.05.025. Epub 2009 Sep 10.

Detection of macular ganglion cell loss in glaucoma by Fourier-domain optical coherence tomography

Affiliations

Detection of macular ganglion cell loss in glaucoma by Fourier-domain optical coherence tomography

Ou Tan et al. Ophthalmology. 2009 Dec.

Abstract

Purpose: To map ganglion cell complex (GCC) thickness with high-speed Fourier-domain optical coherence tomography (FD-OCT) and compute novel macular parameters for glaucoma diagnosis.

Design: Observational, cross-sectional study.

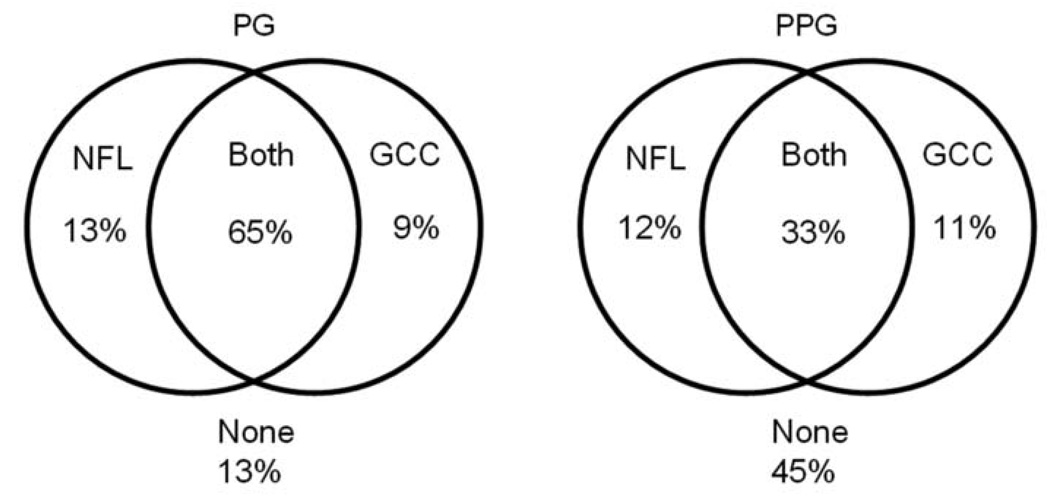
Participants: One hundred seventy-eight participants in the Advanced Imaging for Glaucoma Study, divided into 3 groups: 65 persons in the normal group, 78 in the perimetric glaucoma group (PG), and 52 in the preperimetric glaucoma group (PPG).

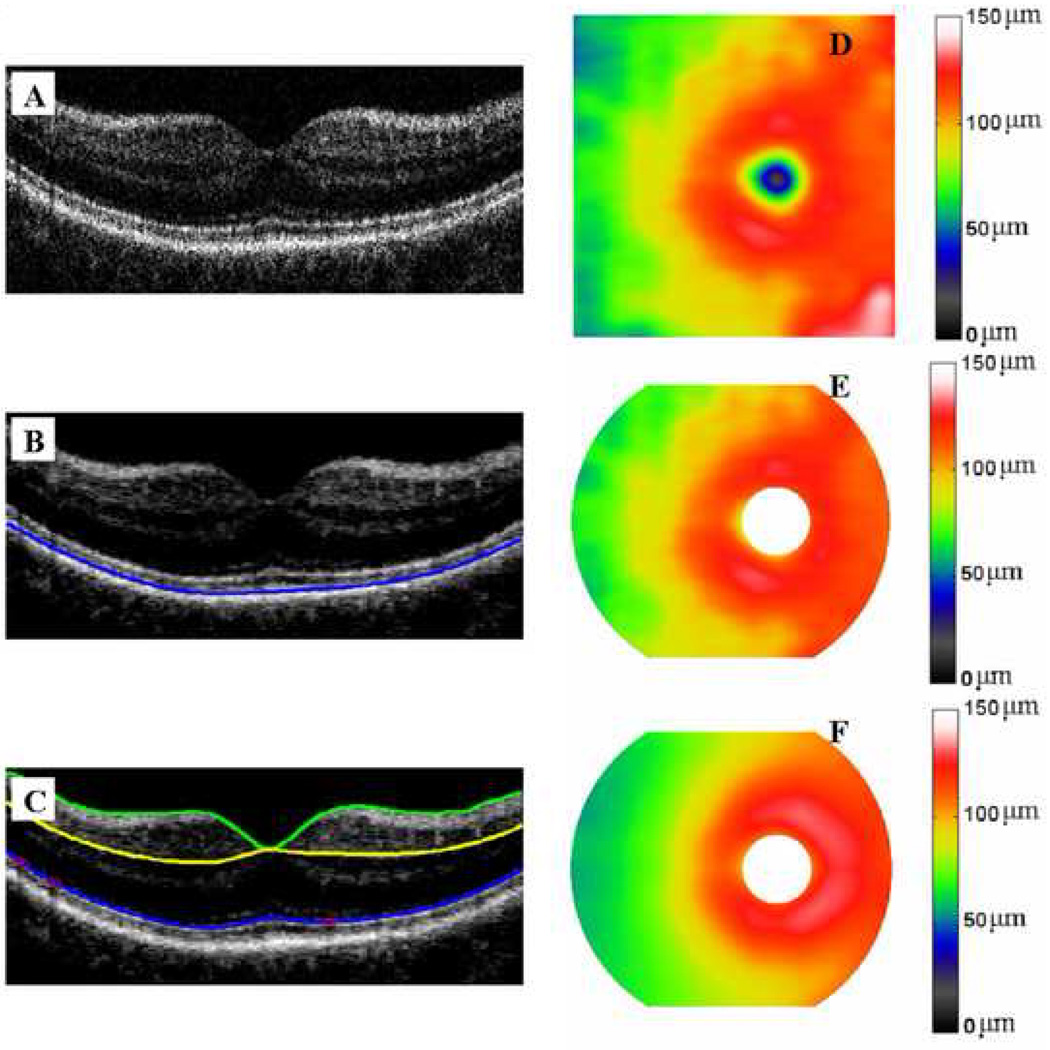
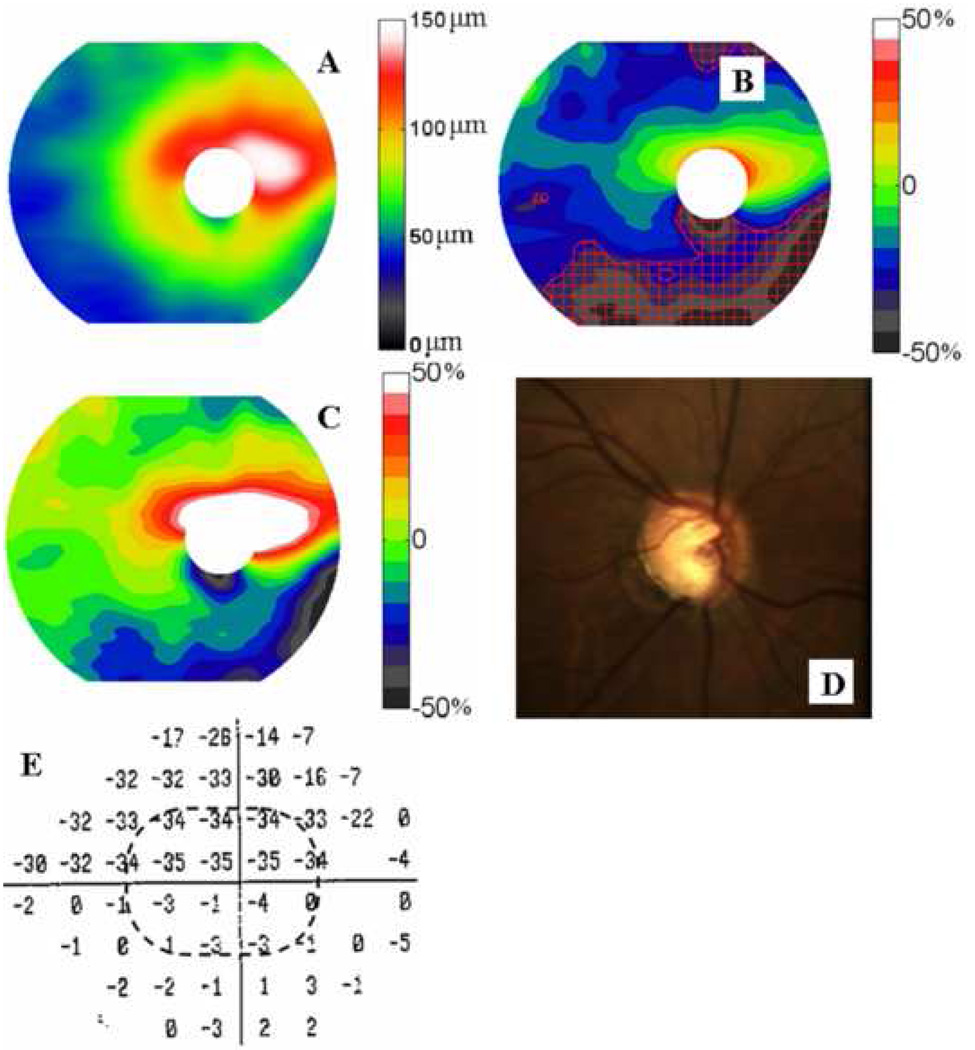
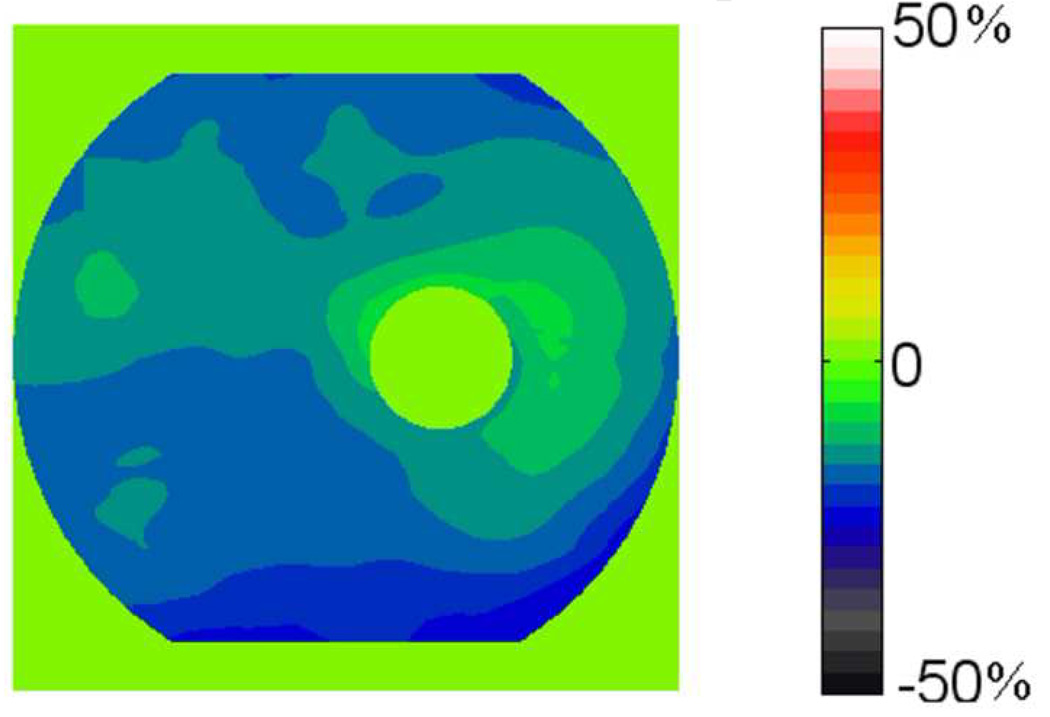
Methods: The RTVue FD-OCT system was used to map the macula over a 7 x 6 mm region. The macular OCT images were exported for automatic segmentation using software we developed. The program measured macular retinal (MR) thickness and GCC thickness. The GCC was defined as the combination of nerve fiber, ganglion cell, and inner plexiform layers. Pattern analysis was applied to the GCC map and the diagnostic powers of pattern-based diagnostic parameters were investigated. Results were compared with time-domain (TD) Stratus OCT measurements of MR and circumpapillary nerve fiber layer (NFL) thickness.

Main outcome measures: Repeatability was assessed by intraclass correlation, pooled standard deviation, and coefficient of variation. Diagnostic power was assessed by the area under the receiver operator characteristic (AROC) curve. Measurements in the PG group were the primary measures of performance.

Results: The FD-OCT measurements of MR and GCC averages had significantly better repeatability than TD-OCT measurements of MR and NFL averages. The FD-OCT GCC average had significantly (P = 0.02) higher diagnostic power (AROC = 0.90) than MR (AROC = 0.85 for both FD-OCT and TD-OCT) in differentiating between PG and normal. One GCC pattern parameter, global loss volume, had significantly higher AROC (0.92) than the overall average (P = 0.01). The diagnostic powers of the best GCC parameters were statistically equal to TD-OCT NFL average.

Conclusions: The higher speed and resolution of FD-OCT improved the repeatability of macular imaging compared with standard TD-OCT. Ganglion cell mapping and pattern analysis improved diagnostic power. The improved diagnostic power of macular GCC imaging is on par with, and complementary to, peripapillary NFL imaging. Macular imaging with FD-OCT is a useful method for glaucoma diagnosis and has potential for tracking glaucoma progression.


Figures

Figure 1
Figure 1
Vertical optical coherence tomography (OCT) cross section of the macula. The image was acquired using the RTVue Fourier-domain (FD) OCT system. The ganglion cell complex (GCC) consists of 3 layers: nerve fiber layer (NFL), ganglion cell layer (GCL) and inner plexiform layer (IPL). The three boundaries on the image are inner limiting membrane (ILM), outer IPL boundary and inner segment/outer segment (IS/OS) junction. The GCC thickness is measured from the ILM to the outer IPL boundary. The retinal thickness is measured from the ILM to the IS/OS junction.
Figure 2
Figure 2
The ganglion cell complex (GCC) scan pattern consists of 15 vertical and 1 horizontal scan lines shown overlaid on a red-free fundus photograph.
Figure 3
Figure 3
Image processing steps in the automated measurement of ganglion cell complex (GCC) and retinal thickness. (A) A vertical optical coherence tomography (OCT) cross-section from the GCC scan is shown. (B) The OCT image was low-pass filtered and re-sampled at lower definition to suppress speckle and speed processing. The photoreceptor pigment-epithelium complex (PPC, blue line) was identified. (C) The inner segment/outer segment (IS/OS) junction (blue line) was detected from within the PPC. The inner limited membrane (ILM, green line) and outer boundary of the outer plexiform layer (OPL, yellow line) were also detected. Blood vessel shadowed axial-scans (A-scans, red circle) were replaced with adjacent A-scans to avoid interruption of boundary lines. (D) Macular GCC thickness map was obtained by interpolation of the GCC profiles from the 16 OCT cross-sections in the GCC scan pattern. (E) The GCC map was re-centered on the foveal depression. Unreliable portions of the map were removed (cropped out on map shown). These include the foveal area (1.5 mm diameter); top and bottom 0.5mm; and the corner regions with distance from map center > 3.5mm. (F) The reference GCC map is averaged from all eyes in the normal (N) group.
Figure 4
Figure 4
A perimetric glaucoma (PG) case example. All of the ganglion cell complex (GCC) parameters were abnormal (average = 71 µm, p < 0.5%; focal loss volume (FLV) =12.6%, p < 0.5%, global loss volume (GLV) = 26.5%, p < 0.5%; pattern coefficient of variation (PCV) = 21%, p < 0.5%; superior-inferior difference (SID) = 17.0 µm, p < 0.5%). (A) GCC map. (B) Fractional deviation map with areas of significant focal loss marked by red hatching. (C) GCC pattern deviation (PD) map. (D) Disc photo showing inferotemporal rim loss. (E) Visual field (VF) PD map. The VF was abnormal (pattern standard deviation = 16.5dB, p < 0.5%; glaucoma hemifield test was outside normal limits. The elliptical dashed line shows the area corresponding to the GCC maps. The superior VF defect corresponded to the inferior GCC loss and disc rim thinning.
Figure 5
Figure 5
The average ganglion cell complex (GCC) fractional deviation map of the perimetric glaucoma (PG) group.
Figure 6
Figure 6
A pre-perimetric glaucoma (PPG) case example. (A) Ganglion cell complex (GCC) fraction deviation (FD) map. Some of the GCC parameters were abnormal (average = 82.5 µm, p > 5%; focal loss volume (FLV) = 4.9%, P<0.5%, global loss volume (GLV) = 13.2%, p < 0.5%; pattern coefficient of variation (PCV) = 13%, P>5%; superior-inferior difference (SID) = −12.1 µm, p <0.5%;) (B) Disc photograph showed mild thinning of the superotemporal rim. (C) Visual field pattern deviation map showed scattered shallow depressions that were within the range of normal variation.
Figure 7
Figure 7
Venn diagrams showing the overlap between abnormal nerve fiber layer (NFL) and ganglion cell complex (GCC) thicknesses in both perimetric glaucoma (PG) and pre-perimetric glaucoma (PPG) groups. Abnormalities were detected at the 5 percentile level.

References

    1. Quigley HA, Dunkelberger GR, Green WR. Retinal ganglion cell atrophy correlated with automated perimetry in human eyes with glaucoma. Am J Ophthalmol. 1989;107:453–464. - PubMed
    1. Quigley HA, Miller NR, George T. Clinical evaluation of nerve fiber layer atrophy as an indicator of glaucomatous optic nerve damage. Arch Ophthalmol. 1980;98:1564–1571. - PubMed
    1. Sommer A, Miller NR, Pollack I, et al. The nerve fiber layer in the diagnosis of glaucoma. Arch Ophthalmol. 1977;95:2149–2156. - PubMed
    1. Sommer A, Quigley HA, Robin AL, et al. Evaluation of nerve fiber layer assessment. Arch Ophthalmol. 1984;102:1766–1771. - PubMed
    1. Pederson JE, Anderson DR. The mode of progressive disc cupping in ocular hypertension and glaucoma. Arch Ophthalmol. 1980;98:490–495. - PubMed

Publication types