. 2009 Oct 30;326(5953):729-33.
doi: 10.1126/science.1177373. Epub 2009 Sep 10.

The transmissibility and control of pandemic influenza A (H1N1) virus

Affiliations

The transmissibility and control of pandemic influenza A (H1N1) virus

Yang Yang et al. Science. .

Abstract

Pandemic influenza A (H1N1) 2009 (pandemic H1N1) is spreading throughout the planet. It has become the dominant strain in the Southern Hemisphere, where the influenza season has now ended. Here, on the basis of reported case clusters in the United States, we estimated the household secondary attack rate for pandemic H1N1 to be 27.3% [95% confidence interval (CI) from 12.2% to 50.5%]. From a school outbreak, we estimated that a typical schoolchild infects 2.4 (95% CI from 1.8 to 3.2) other children within the school. We estimated the basic reproductive number, R0, to range from 1.3 to 1.7 and the generation interval to range from 2.6 to 3.2 days. We used a simulation model to evaluate the effectiveness of vaccination strategies in the United States for fall 2009. If a vaccine were available soon enough, vaccination of children, followed by adults, reaching 70% overall coverage, in addition to high-risk and essential workforce groups, could mitigate a severe epidemic.


Figures
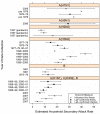
Fig. 1
Fig. 1
Estimated influenza illness and infection household secondary attack rates from this study and a PubMed literature search. Detailed information on the search references is given in (Sec. 2 (15) and Table S8). The household illness secondary attack rate is based on onset date of an influenza-like illness. Lab confirmed illness is confirmed through a virus-positive nasopharyngeal or throat swab taken at the time of the influenza-like illness. The household infection secondary attack rate is based on paired sera bracketing the usual influenza season, where an infection is defined as a significant rise in hemagglutination-inhibition titer comparing the pre-influenza season sample to the post-influenza season sample. The 95% confidence intervals are taken from the referenced paper or calculated by the authors if sufficient information was presented. Estimates from pandemic strains include the current estimate and those from Asian influenza A (H2N2) in 1957. The influenza A (H1N1) strain of 1978-1979 re-emerged after being absent since 1957. The influenza A (H5N1) strain in 2006 was an avian strain that did not spread beyond the initial family clusters.
Fig. 2
Fig. 2
Observed and simulated age-specific fraction of influenza cases and illness attack rates, with R0 = 1.6. The left plot shows the observed proportion of reported pandemic H1N1 cases by age group in the USA during the early days of the reported USA epidemic. The next two plots show the simulated proportion at different times after introduction of cases into the Los Angeles County area. The age distribution of cases at 21 days of the simulated epidemic is similar to that of the early observed epidemic. As reflected in the laterepidemic, older age groups would become more involved as the infections spreads beyond schools and households. The final plot shows the simulated age-specific illness attack rates by the end of an epidemic that runs to completion in the Los Angeles County area. This final age-specific attack rate pattern is similar to that observed for the 1957-1958 Asian A (H2N2) pandemic (37).
Fig. 3
Fig. 3
Simulated illness attack rate for the USA and projected total number of global cases for one year of pandemic influenza at different levels of R0. The projections are obtained by multiplying the simulated illness attack rates by the world population of 6.8 billion.
Fig. 4
Fig. 4
Simulated effect of prevaccination with a homologously and heterologously matched pandemic influenza vaccine at different levels of R0 and coverage for USA. A. Overall illness attack rates for homologous vaccine. Lines indicate the average illness attack rate over five simulations of Los Angeles County for each value of R0 with the vaccine efficacies summarized in Table S9. The 95% error bars indicate the empirical confidence intervals for 100 simulations where the vaccine efficacy parameters are chosen randomly within 15% of their estimated values. B. Epidemic curves at R0 = 1.6 with homologous vaccine. C. Overall illness attack rates with a heterologous vaccine and 95% error bars indicating the empirical confidence intervals when varying the vaccine efficacy parameters. D. Epidemic curves at R0 = 1.6 with heterologous vaccine.
Fig. 4
Fig. 4
Simulated effect of prevaccination with a homologously and heterologously matched pandemic influenza vaccine at different levels of R0 and coverage for USA. A. Overall illness attack rates for homologous vaccine. Lines indicate the average illness attack rate over five simulations of Los Angeles County for each value of R0 with the vaccine efficacies summarized in Table S9. The 95% error bars indicate the empirical confidence intervals for 100 simulations where the vaccine efficacy parameters are chosen randomly within 15% of their estimated values. B. Epidemic curves at R0 = 1.6 with homologous vaccine. C. Overall illness attack rates with a heterologous vaccine and 95% error bars indicating the empirical confidence intervals when varying the vaccine efficacy parameters. D. Epidemic curves at R0 = 1.6 with heterologous vaccine.
Fig. 5
Fig. 5
Simulated effect of phased pandemic influenza vaccination for homologous and heterologous vaccines at different levels of R0 and coverage for USA. A. Vaccine coverage over time with a 30 day delay. Vaccine is delivered at a rate of 120 million doses each month or about 20% coverage per month. This is enough vaccine to give 60 million people with two doses, three weeks apart per month. Vaccine is delivered uniformly over the month. Day 0 is the beginning of pandemic H1N1 spread in the USA. When there is no delay in vaccine supply, vaccination would start on day 0. The dotted lines show the coverage for a strategy to vaccinate children first (red line) and then adults (blue line) starting when coverage reaches 70% in children. B. Epidemic curves when R0 = 1.6 for homologous and heterologous vaccines, delivered with a 30 day delay. Both universal and the children first vaccination strategies are shown. C. Overall illness attack rates for homologous vaccine for the universal and child first vaccination strategies, both with and without the 30 day delay. D. Overall illness attack rates for heterologous vaccine for the universal and children first vaccination strategies, both with and without the 30 day delay.
Fig. 5
Fig. 5
Simulated effect of phased pandemic influenza vaccination for homologous and heterologous vaccines at different levels of R0 and coverage for USA. A. Vaccine coverage over time with a 30 day delay. Vaccine is delivered at a rate of 120 million doses each month or about 20% coverage per month. This is enough vaccine to give 60 million people with two doses, three weeks apart per month. Vaccine is delivered uniformly over the month. Day 0 is the beginning of pandemic H1N1 spread in the USA. When there is no delay in vaccine supply, vaccination would start on day 0. The dotted lines show the coverage for a strategy to vaccinate children first (red line) and then adults (blue line) starting when coverage reaches 70% in children. B. Epidemic curves when R0 = 1.6 for homologous and heterologous vaccines, delivered with a 30 day delay. Both universal and the children first vaccination strategies are shown. C. Overall illness attack rates for homologous vaccine for the universal and child first vaccination strategies, both with and without the 30 day delay. D. Overall illness attack rates for heterologous vaccine for the universal and children first vaccination strategies, both with and without the 30 day delay.

Similar articles

Cited by

References

    1. World Health Organization Novel Influenza A (H1N1) - Update 59. [accessed July 28, 2009]. Jul 272009. http://www.who.int/csr/don/2009_07_27/en/index.html.
    1. Chan M. World now at start of 2009 influenza pandemic. statement to the press by WHO director-general. [accessed July 28, 2009]. Jun 112009. http://www.who.int/mediacentre/news/statements/2009/h1n1_pandemic_phase6....
    1. Centers for Disease Control and Prevention Swine Influenza A (H1N1) infection in two children–Southern California, March-April 2009. 2009. http://www.cdc.gov/mmwr/PDF/wk/mm5815.pdf. - PubMed
    1. Center for Diseases Control and Prevention Update: swine influenza A (H1N1) infections–California and Texas, April 2009. 2009. http://www.cdc.gov/mmwr/PDF/wk/mm5816.pdf. - PubMed
    1. Kansas Department of Health and Environment Swine influenza news conference. [accessed April 29, 2009]. Apr 292009. http://www.dhe.state.ks.us/SwineFlu/swineflunewsconf.wmv.

Publication types

Substances