. 2009 Nov 18;28(22):3500-13.
doi: 10.1038/emboj.2009.250. Epub 2009 Sep 10.

SnoN functions as a tumour suppressor by inducing premature senescence

Affiliations

SnoN functions as a tumour suppressor by inducing premature senescence

Deng Pan et al. EMBO J. .

Abstract

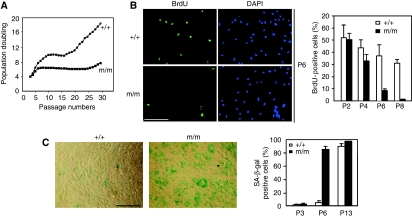
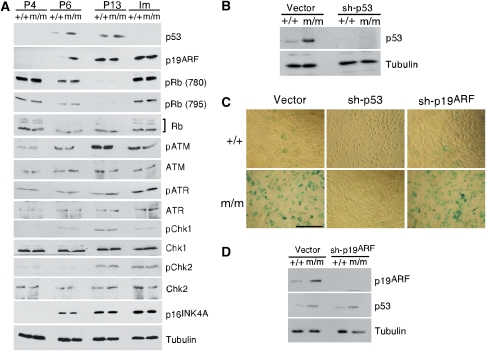
SnoN represses TGF-beta signalling to promote cell proliferation and has been defined as a proto-oncogene partly due to its elevated expression in many human cancer cells. Although the anti-tumourigenic activity of SnoN has been suggested, the molecular basis for this has not been defined. We showed here that high levels of SnoN exert anti-oncogenic activity by inducing senescence. SnoN interacts with the promyelocytic leukaemia (PML) protein and is recruited to the PML nuclear bodies where it stabilizes p53, leading to premature senescence. Furthermore, overexpression of SnoN inhibits oncogenic transformation induced by Ras and Myc in vitro and significantly blocks papilloma development in vivo in a carcinogen-induced skin tumourigenesis model. The few papillomas that were developed displayed high levels of senescence and spontaneously regressed. Our study has revealed a novel Smad-independent pathway of SnoN function that mediates its anti-oncogenic activity.


Conflict of interest statement

The authors declare that they have no conflict of interest.

Figures

Figure 1
Figure 1
Generation of SnoN knock-in mice. (A) Targeting constructs. The BamHI fragment of mouse snoN genomic DNA containing exon I and the flanking sequences were subcloned into pBluescript. The R-Smad binding site between residues 85–88 and Co-Smad binding site between residues 266–267 in exon I were mutated to alanine (shown as 85–88AAAA and 266, 267AA, respectively), and a neomycin resistance gene flanked by two LoxP sequences was inserted into intron I. These mutations also generated new SphI and SwaI cleavage sites. (B) Genomic DNA was prepared from MEF. DNA fragment encompassing exon I was amplified by PCR and digested using SphI to yield a 1-kb fragment for WT snoN and 0.8-kb fragment for mSnoN. (C) Mutant MEF showed enhanced TGF-β transcription. p3TP-Lux was transfected into the WT and m/m MEF. Luciferase activity was measured 16 h after TGF-β treatment. (D) Mutant MEFs are more sensitive to TGF-β-induced growth arrest. A total of 5 × 10⁴ WT or m/m MEFs were cultured in the presence of TGF-β. The growth of cells was measured four days later by cell counting and compared with that of un-stimulated cells.
Figure 2
Figure 2
The snoN knock-in mice are resistant to chemical carcinogen-induced skin tumourigenesis. (A) Schematic representation of the two-step skin carcinogenesis protocol. (B) Percentage of mice that developed papilloma within a 30-week window is shown in the graph. Graph in (C) shows average number of papilloma per mouse. (D) The size distributions of papillomas from WT and m/m mice. (E) H&E staining of papilloma sections from +/+ or m/m mice (scale bar: 200 μm). (F) Lysates from papilloma samples were subjected to western blotting to measure the expression of p53, p16INK4a or phospho-ERK. Tubulin was used as a loading control. (G) Frozen papilloma sections from +/+ or m/m mice were stained using SA-β-Gal (scale bar: 100 μm). (H) Tumour sections were stained using anti-p19ARF (green; scale bar: 100 μm). The boxed areas were amplified to show the nucleolus staining of p19ARF (scale bar: 30 μm). Nuclei were stained using DAPI (blue).
Figure 3
Figure 3
MEFs from the snoN knock-in mice showed premature senescence. (A) WT or m/m MEFs were passaged according to the 3T9 protocol. Population doubling was measured by cell counting every 3 days. (B) BrdU incorporation. WT or m/m MEFs, at P6, were incubated in a medium containing BrdU followed by staining with anti-BrdU (scale bar: 40 μm). Quantification of BrdU-positive cells is shown in the graph. (C) SA-β-gal staining. WT or m/m MEFs, at P6, were subjected to staining with SA-β-gal (scale bar: 100 μm). Quantification is shown in the graph.
Figure 4
Figure 4
Elevated SnoN expression is responsible for premature senescence of m/m MEFs. (A) SnoN expression is elevated in m/m MEFs. Total cell lysates from WT and m/m MEFs were subjected to western blotting with anti-SnoN. Tubulin was used as a loading control. (B) snoN−/− MEFs do not undergo premature senescence. MEFs prepared from snoN−/− or WT mice were passaged according to the 3T9 protocol. SA-β-gal staining was carried out on cells at P6 and P13 (scale bar: 100 μm). (C) A siRNA mixture targeting both Smad2 and Smad3 was transfected into m/m MEFs at P4. Levels of Smad2, Smad3 and Smad7 were assessed by western blotting 48 h after the transfection. (D) Reducing Smad signalling does not affect premature senescence of m/m MEFs. WT or m/m MEFs, expressing the siRNA mixture, were stained with SA-β-gal at P6 (scale bar: 100 μm). (E) Reducing Smad3 expression by shRNA. The expression of Smad3 and Smad7 was measured by western blotting. (F) Senescence of MEFs expressing shSmad3 was assessed by SA-β-gal staining at P6 (scale bar: 100 μm). (G) shRNA targeting SnoN or HA–SnoN cDNA in retroviral vectors was introduced into m/m MEFs. (H) SnoN expression was evaluated by western blotting, and senescence of these cells was evaluated by SA-β-gal staining at P6 (scale bar: 100 μm).
Figure 5
Figure 5
p53 is required for the premature senescence of m/m MEFs. (A) p53 and p19ARF are upregulated on premature senescence of m/m MEFs. Expression levels of a variety of proteins were compared in WT and m/m MEFs at P4, P6, P13 and on immortalization (Im). This figure panel was assembled from multiple gels with identical samples. The bracket indicates total Rb. Tubulin was used as a loading control. (B) Reducing p53 expression by shRNA. p53 levels in MEFs expressing sh-p53 were measured by western blotting. (C) Senescence of m/m MEFs expressing sh-p53 or sh-p19ARF was determined by SA-β-gal staining at P6 (scale bar: 100 μm). (D) p19ARF and p53 levels in MEFs expressing sh-p19ARF were measured by western blotting.
Figure 6
Figure 6
Interaction between SnoN and PML is required for premature senescence. (A) Endogenous SnoN (red) and PML (green) were stained with anti-SnoN or anti-PML antibodies, respectively, in WT and m/m MEFs at different passages (scale bar: 10 μm). Nuclei were stained using DAPI (Blue). (B) Flag–SnoN was introduced into WT MEFs and stained with anti-Flag. Endogenous PML was stained with anti-PML (scale bar: 10 μm). (C) Reduction of PML expression by shRNA. The levels of PML and p53 were measured by western blotting. (D) PML is required for SnoN-induced premature senescence. SA-β-gal staining was carried out at P6 in m/m MEFs expressing sh-PML (scale bar: 100 μm). (E) SnoN physically associates with PML. Interaction of His-PML with Flag–SnoN (WT or mutant) in co-transfected 293T cells was measured by immunoprecipitation with anti-Flag antibody followed by western blotting with anti-PML antibody. PML levels in the lysate were blotted using anti-PML antibody. (F) Interaction between endogenous SnoN and PML at P6 in MEFs was measured by immunoprecipitation with anti-PML antibody followed by western blotting with anti-SnoN antibody. Total PML and SnoN levels were measured by western blotting. (G) Left: schematic drawing of WT and mutant SnoN proteins. Right: interaction of Flag–SnoN with His-PML was measured as described in (E). (H) Interaction of SnoN with PML is required for SnoN-induced premature senescence. Flag-tagged WT or mutant SnoN was introduced into WT MEFs at P3 through retroviral infection. (I) At P7, expression of p53, PML and SnoN were evaluated through western blotting and senescence was measured through SA-β-gal staining (scale bar: 100 μm). (J). SnoNΔ322–366 fails to co-localize with PML. Immunofluorescence staining was performed with anti-Flag (SnoN) and anti-PML antibodies (scale bar: 10 μm).
Figure 7
Figure 7
SnoN upregulates PML expression to mediate p53 stabilization. PML expression is upregulated in the m/m MEFs as measured by (A) RT–PCR and (B) western blotting at P6. (B) SnoN is required for PML upregulation. The levels of PML and SnoN in control or shSnoN-expressing cells were determined by western blotting. (C) SnoN interacts with both PML and p53 in senescent cells. The levels of SnoN, PML and p53 in nuclear extracts prepared from WT or m/m MEFs at P1, P6 and P13 were measured by western blotting. Interaction of SnoN with PML and p53 was examined by immunoprecipitation with anti-SnoN antibody followed by western blotting with anti-PML or anti-p53 antibody. (D) SnoN and p53 co-localized in senescence cells. Endogenous SnoN (red) and p53 (green) were stained with anti-SnoN or anti-p53, respectively, in MEFs at P13. (E) SnoN level is not affected by PML. The levels of SnoN, PML and p53 in MEFs expressing sh-PML were determined by western blotting. (F) Model for the pro-oncogenic and anti-oncogenic functions of SnoN.
Figure 8
Figure 8
Oncogenic transformation of MEFs. (A) SnoN inhibits the transformation of MEFs. WT or m/m MEFs at P3 were first infected with retroviruses expressing shRNA or HA–SnoN, and infected again with retroviruses expressing H-Ras (Q61L) and c-Myc, either individually or together, and subjected to a soft-agar assay (scale bar: 40 μm). The colonies were visualized by MTT staining and quantified (shown in the graph to the right). (B) m/m MEFs enhanced oncogene-induced senescence. WT or m/m MEFs expressing H-Ras (Q61L) either alone, or together with c-Myc or SnoNΔ322–366 were subjected to SA-β-gal staining (scale bar: 100 μm). (C) Disruption of the SnoN–PML interaction turns SnoN into a bona fide oncogene. WT MEFs at P3 were sequentially infected with retroviruses expressing SnoN (WT or SnoNΔ322–366) first and later with H-Ras (Q61L) and c-Myc either individually or together, and subjected to a soft-agar assay (scale bar: 40 μm). (D) Inactivation of p53 abolishes the tumour suppressor activity of SnoN. WT or p53−/− MEFs expressing either WT, mutant SnoN, various siRNA or shRNA were subjected to a soft-agar assay. The soft-agar colonies were visualized by MTT (left; scale bar: 40 μm) and quantified. (* enlarged figures are showed in Supplementary Figure 2).

Comment in

Similar articles

Cited by

References

    1. Balmain A, Brown K, Akhurst RJ, Fee FM (1988) Molecular analysis of chemical carcinogenesis in the skin. Br J Cancer Suppl 9: 72–75 - PMC - PubMed
    1. Bartkova J, Rezaei N, Liontos M, Karakaidos P, Kletsas D, Issaeva N, Vassiliou LV, Kolettas E, Niforou K, Zoumpourlis VC, Takaoka M, Nakagawa H, Tort F, Fugger K, Johansson F, Sehested M, Andersen CL, Dyrskjot L, Orntoft T, Lukas J et al. (2006) Oncogene-induced senescence is part of the tumorigenesis barrier imposed by DNA damage checkpoints. Nature 444: 633–637 - PubMed
    1. Bernardi R, Pandolfi PP (2007) Structure, dynamics and functions of promyelocytic leukaemia nuclear bodies. Nat Rev Mol Cell Biol 8: 1006–1016 - PubMed
    1. Blasco MA, Lee HW, Hande MP, Samper E, Lansdorp PM, DePinho RA, Greider CW (1997) Telomere shortening and tumor formation by mouse cells lacking telomerase RNA. Cell 91: 25–34 - PubMed
    1. Bode AM, Dong Z (2004) Post-translational modification of p53 in tumorigenesis. Nat Rev Cancer 4: 793–805 - PubMed

Publication types

MeSH terms