. 2009 Dec;8(6):666-75.
doi: 10.1111/j.1474-9726.2009.00523.x. Epub 2009 Oct 11.

Mortality shifts in Caenorhabditis elegans: remembrance of conditions past

Affiliations

Mortality shifts in Caenorhabditis elegans: remembrance of conditions past

Deqing Wu et al. Aging Cell. 2009 Dec.

Abstract

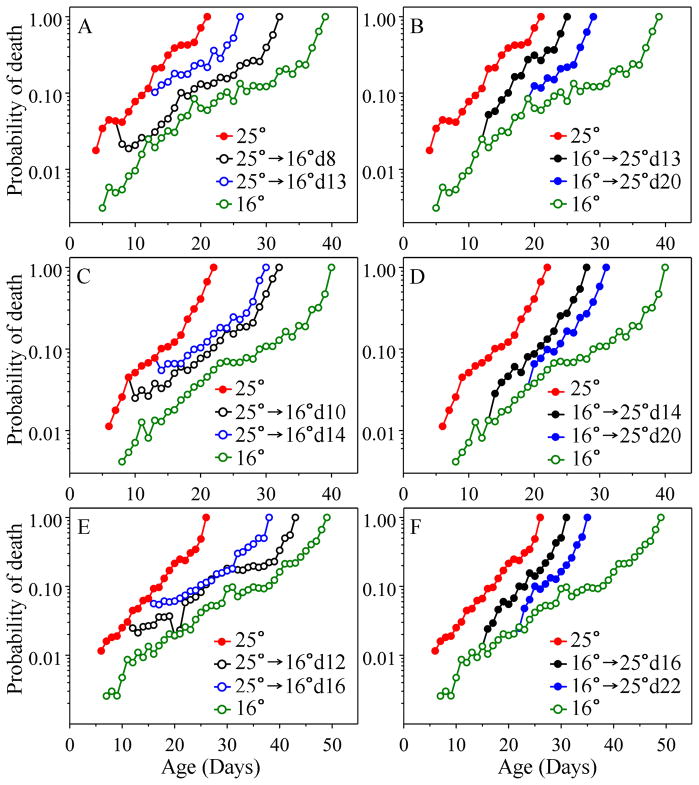
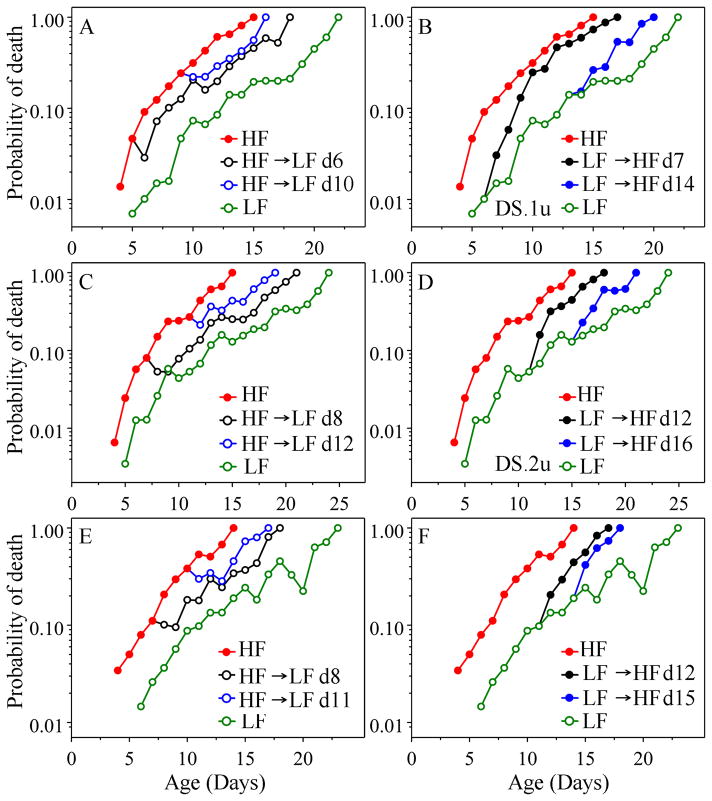
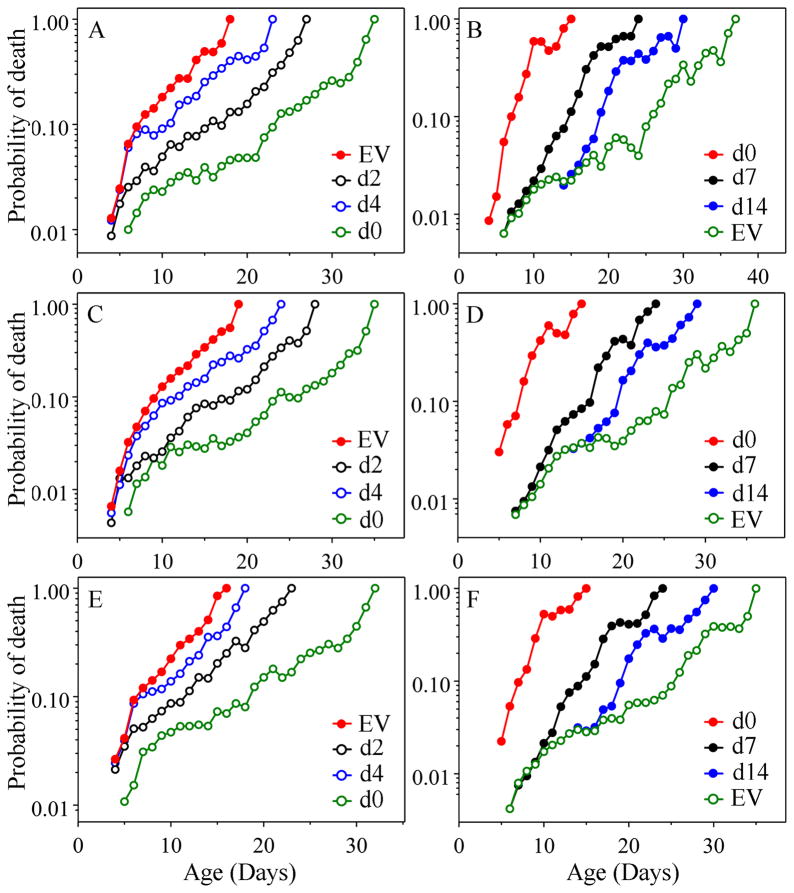
The analysis of age-specific mortality can yield insights into how anti-aging interventions operate that cannot be matched by simple assessment of longevity. Mortality, as opposed to longevity, can be used to assess the effects of an anti-aging intervention on a daily basis, rather than only after most animals have died. Various gerontogene mutations in Caenorhabditis elegans have been shown to increase longevity as much as tenfold and to decrease mortality at some ages even more. Environmental alterations, such as reduced food intake (dietary restriction) and lower temperature also result in reduced mortality soon after the intervention. Here, we ask how soon anti-aging interventions, applied during adult life, affect age-specific mortality in nematodes. Using maximum likelihood analysis, we estimated the Gompertz parameters after shifts of temperature, and of food concentration and maintenance conditions. In separate experiments, we altered expression of age-1 and daf-16, using RNAi. Using about 44 000 nematodes in total, to examine daily mortality, we find that for both types of environmental shift, mortality responded immediately in the first assessment, while RNAi-induced changes resulted in a slower response, perhaps due to delayed mechanics of RNAi action. However, under all conditions there is a permanent 'memory' of past states, such that the initial mortality component [a] of the Gompertz equation [mu(x) = ae(bx)] bears a permanent 'imprint' of that earlier state. However, 'b' (the rate of mortality increase with age) is always specified by the current conditions.


Figures

Fig. 1
Fig. 1
Age-specific probability of death in response to temperature shift (The sample size and day of shift are detailed in the same order in SI Figure 1(A)). The red and green symbols represent controls maintained at 25°C and at 16°C, respectively. The rates of increase in mortality of 25°C controls are significantly higher than that of 16 °C controls in three replicates with p values of 3.0E-88, 2.1E-88 and 5.3E-93, respectively (SI Table 1). The black and the blue lines with open circles (A, C, E) represent the first and the second down shift from 25°C to 16 °C, respectively, whereas the black and blue lines with filled circles (B, D, F) represent the first and the second up shift from 16°C to 25°C, respectively. (A) Down shifts on day 8 and day 13 in the first experiment. For both the day-8 down-shift population and the day-13 down-shift population, the probability of death becomes significantly lower than that of the 25°C control as soon as the first day post-shift (p = 0.0094 and p = 4.1E-05, respectively, SI Table 2). Their mortality trajectories are significantly lower than that of 25°C (p = 2.1E-45 and p = 3.9E-19, respectively, SI Table 1), but are not significantly different from 16°C control (p = 0.1454 and p = 0.8875). (B) Up shifts on day 13 and 20 in the first experiment. After shifting to 25°C from 16°C, both up-shift populations show significantly higher daily probability of death as soon as the first day post-shift, with p values of 1.9E-05 and 0.0003, respectively and also significantly higher mortality trajectories (p = 3.5E-20 and p = 9.9E-09, respectively) in comparison to 16°C. However, their rates of increase in mortality are not significantly different from that of the 16°C control (p = 0.0385 and p = 0.1110, respectively). (C) Down shifts on day 10 and day 14 in the second experiment. Results are similar to A. (D) Up shifts on day 14 and day 20 in the second experiment. Results are similar to B. (E) Down shifts on day 12 and day 16 in the third experiment. Results are similar to A. (F) Up shifts on day 16 and 22 in the third experiment. Results are similar to B.
Fig. 2
Fig. 2
Age-specific probability of death in response to dietary shift. Three replicates were represented by panels A–B, C–D and E–F, respectively. The sample sizes and days of shift are detailed in the same order in SI Figure 1(B). The red line with filled circles and the green line with open circles are the high food (HF, confluent RW2 on NGM plates) control without shift and the low food (LF, 1 × 10⁹/ml RW2 in liquid medium) control without shift, respectively. The rates of increase in mortality of HF controls are significantly higher than that of LF controls in all three replicates, with p values of 7.5E-61, 4.8E-86 and 4.7E-67, respectively (SI Table 4). The black line with open circles and the blue line with open circles represent the first and the second down shift, respectively, from HF to LF. The black line with filled circles and the blue line with filled circles represent the first and the second up shift from LF to HF, respectively. (A) Down shifts on day 6 and 10 in the first experiment. In comparison to HF control, the probability of death of day 6 down-shift population decreases significantly with p values of 8.5E-07, 0.0006 and 7.1E-05 on the first, second and third days post-shift, respectively (SI Table 5). Its rate of increase in mortality is significantly lower than that of HF control as well (p = 4.4E-32, SI Table 4). However, its rate of increase in mortality is not significantly different from that of the LF control (p = 0.2774). For the day-10 down-shift population, the probability of death decreases significantly as soon as the first day post shift (p = 0.0029), and the rate of increase in mortality is significantly lower than that of HF control (p = 1.2E-07) but not significantly different from that of LF control (p = 0.8875). (B) Up shifts from LF to HF on day 7 and 14 in the first experiment. For both the day-7 up-shift population and the day-14 up-shift population, the rates of increase in mortality are significantly higher than that of the LF control (p = 2.7 E-15 and p = 1.7E-06, respectively) but not significantly different from the HF control (p = 0.0719 and p = 0.2301, respectively), and daily probability of death increase significantly with p values on the second day post-shift of 2.6 E-08 and 0.0086, respectively. (C) Down shifts on day 8 and 12 in the second experiment. Results are similar to A. (D) Up shifts on day 12 and 16 in the second experiment. Results are similar to B. (E) Down shifts on day 8 and 11 in the third experiment. Results are similar to A. (F) Up shifts on day 12 and 15 in the third experiment. Results are similar to B.
Fig. 3
Fig. 3
Age-specific probability of death in response to RNAi. The sample size and day of RNAi treatment are detailed in SI Figure 1(C and D) in the same order. For both the down-shift and the up-shift, empty vector (EV) is pL4440. In the three replicates of daf-2 RNAi shift (A, C, E), red line with filled circles represents worms on empty vector only, whereas green, black, and blue lines with open circles represent shifts from empty vector to daf-2 RNAi on day 0, day 2 and day 4, respectively. In the three replicates of the daf-16 RNAi shift (B, D, F), green line with open circles represents TJ1062 worms on empty vector without shift; while red, black and blue lines with filled circles represent shifts from empty vector to daf-16 RNAi on day 0, day 7 and day 14, respectively. (A) The first experiment of daf-2 RNAi down shift. The first days on which daily probability of death becomes significantly lower than that of EV control for shift populations on day 0, day 2 and 4 are the 5th day post-shift, the 5th day post-shift and 6th day post-shift, respectively (SI Table 9). The rates of increase in mortality of all three shifted populations are significantly lower than that of the EV control (p = 2.9E-93, p = 1.4E-63 and p = 6.9E-51, respectively, SI Table 8). However, neither the day-2 shift nor the day-4 shift display the same rate of increase in mortality as does the group shifted on day 0; instead their rates are significantly higher than that of the group shifted on day 0 (p = 0.0092 and p = 2.5E-07, respectively). (B) the first experiment of daf-16 RNAi up shift. The first days on which daily probability of death becomes significantly higher than that of the EV control for populations shifted on day 0, day 7 and 14 are the 5th day post-shift, the 6th day post-shift and 6th day post-shift, respectively (SI Table 9). The rates of increase in mortality of all three shift populations are significantly higher than that of the EV control (p = 1.7E-94, p = 4.1E-40 and p = 1.9E-26, respectively, SI Table 8). In comparison with the population shifted on day 0, both populations shifted on day 7 and day 14 show significantly lower rates of increase in mortality (p = 7.2E-13 and p = 3.6 E-23, respectively). (C) Second replicate of daf-2 RNAi down shift. Results are similar to A. (D) Second replicate of daf-16 RNAi up shift. Results are similar to B. (E) Third replicate of daf-2 RNAi down shift. Results are similar to A. (F) Third replicate of daf-16 RNAi up shift. Results are similar to B.

References

    1. Aballay A, Yorgey P, Ausubel F. Salmonella typhimurium proliferates and establishes a persistent infection in the intestine of Caenorhabditis elegans. Curr Biol. 2000;10:1539–1542. - PubMed
    1. Arantes-Oliveira N, Berman JR, Kenyon C. Healthy animals with extreme longevity. Science. 2003;302:611. - PubMed
    1. Ayyadevara S, Alla R, Thaden JJ, Shmookler Reis RJ. Remarkable longevity and stress resistance of nematode PI3K-null mutants. Aging Cell. 2008;7:13–22. - PubMed
    1. Berrigan D, Perkins SN, Haines DC, Hursting SD. Adult-onset calorie restriction and fasting delay spontaneous tumorigenesis in p53-deficient mice. Carcinogenesis. 2002;23:817–822. - PubMed
    1. Carey JR, Liedo P, Muller HG, Wang JL, Vaupel JW. Dual modes of aging in Mediterranean fruit fly females. Science. 1998;281:996–998. - PubMed

Publication types

Substances