. 2009 Sep 14:8:212.
doi: 10.1186/1475-2875-8-212.

The role of simple mathematical models in malaria elimination strategy design

Affiliations

The role of simple mathematical models in malaria elimination strategy design

Lisa J White et al. Malar J. .

Abstract

Background: Malaria has recently been identified as a candidate for global eradication. This process will take the form of a series of national eliminations. Key issues must be considered specifically for elimination strategy when compared to the control of disease. Namely the spread of drug resistance, data scarcity and the adverse effects of failed elimination attempts. Mathematical models of various levels of complexity have been produced to consider the control and elimination of malaria infection. If available, detailed data on malaria transmission (such as the vector life cycle and behaviour, human population behaviour, the acquisition and decay of immunity, heterogeneities in transmission intensity, age profiles of clinical and subclinical infection) can be used to populate complex transmission models that can then be used to design control strategy. However, in many malaria countries reliable data are not available and policy must be formed based on information like an estimate of the average parasite prevalence.

Methods: A simple deterministic model, that requires data in the form of a single estimate of parasite prevalence as an input, is developed for the purpose of comparison with other more complex models. The model is designed to include key aspects of malaria transmission and integrated control.

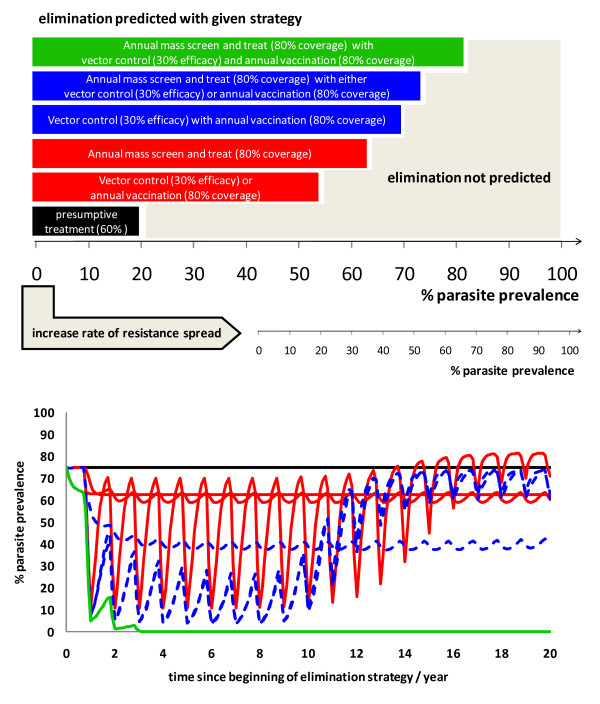
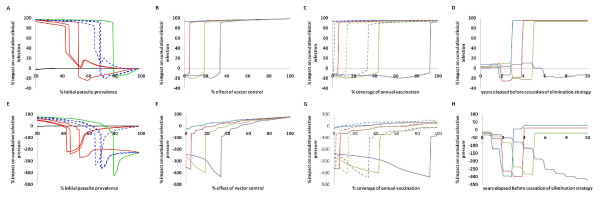
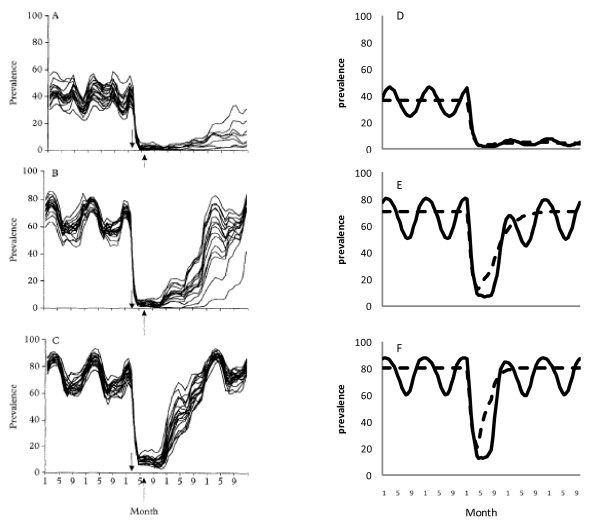
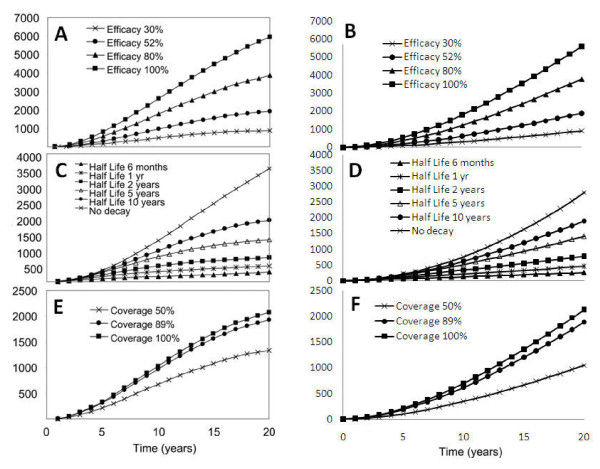
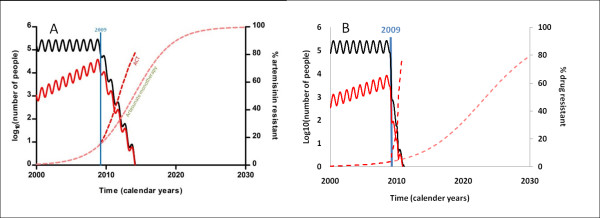
Results: The simple model is shown to have similar short-term dynamic behaviour to three complex models. The model is used to demonstrate the potential of alternative methods of delivery of controls. The adverse effects on clinical infection and spread of resistance are predicted for failed elimination attempts. Since elimination strategies present an increased risk of the spread of drug resistance, the model is used to demonstrate the population level protective effect of multiple controls against this very serious threat.

Conclusion: A simple model structure for the elimination of malaria is suitable for situations where data are sparse yet strategy design requirements are urgent with the caveat that more complex models, populated with new data, would provide more information, especially in the long-term.


Figures

Figure 1
Figure 1
Top: Diagram illustrating the % parasite prevalence thresholds under which elimination is predicted for single and combinations of interventions. The large scale represents settings where drug resistance is not spreading and the small scale below represents settings where drug resistance is already spreading. Bottom: A graph showing the percentage parasite prevalence over time for all combinations of up to three currently available control measures (increased vector control; mass screen and treat; annual mass vaccination) compared with treatment of clinical infection only (solid black line). Single measures (solid red) are compared with two combined measures (dashed blue) and three combined measures (solid green).
Figure 2
Figure 2
Graphs showing the percentage impact of specific strategies on cumulative clinical cases (top row) and cumulative drug pressure (bottom row). In graphs A and E, the pre-intervention parasite prevalence was varied for all the strategies used to produce Figure 1, the colour scheme being the same. In the remaining graphs (B-D and F-H) four transmission settings were considered given pre-intervention parasite prevalences of: 65% (light blue); 70% (dark red); 75% (light green); 80% (purple). In graphs B and F the percentage effect on the force of infection of vector control was varied and modelled in combination with mass-vaccination and MSAT at the levels used to produce the green line in Figure 1. In graphs C and G, the level of coverage of annual vaccination was varied for a vaccine with duration of 1 (solid lines) and 10 (dashed lines) years and modelled in combination with vector control and MSAT at the levels used to produce the green line in Figure 1. In graphs D and H, the number of years since the beginning of the elimination strategy (see figure 1) until a reversion to the original control strategy is varied.
Figure 3
Figure 3
Graphs comparing predictions from a complex model (graphs A to C copied from graphs A to C, Figure Three in [17]) and the simple elimination model with (solid) and without (dashed) seasonal forcing (graphs D to F) for the effect on parasite prevalence of a double intervention of MSAT and increased bed net usage for a range of transmission intensities.
Figure 4
Figure 4
Graphs comparing predictions from a complex model (graph A copied from graph a, Figure Four in [18]; graph C copied from graph a, Figure Six in [18]; graph E copied from graph a, Figure Seven in [18]) and the simple elimination model (graphs B, D and F) for the effect of vaccination at birth on cumulative incidence of all malaria infections at various efficacies, with various vaccine half-lives and at various coverage levels respectively.
Figure 5
Figure 5
Graphs comparing predictions from a complex model (graph A copied from Figure Three in [5]) and the simple elimination model (graph B) for the dynamics of sensitive and resistant parasite prevalence during an annual MSAT elimination strategy over 20 years.

References

    1. Rieckmann KH. The chequered history of malaria control: are new and better tools the ultimate answer? Ann Trop Med Parasitol. 2006;100:647–62. doi: 10.1179/136485906X112185. - DOI - PubMed
    1. Cross AP, Singer B. Modelling the development of resistance of Plasmodium falciparum to anti-malarial drugs. Trans R Soc Trop Med Hyg. 1991;85:349–55. doi: 10.1016/0035-9203(91)90286-8. - DOI - PubMed
    1. Mackinnon MJ. Drug resistance models for malaria. Acta Tropica. 2005;94:207–17. - PubMed
    1. Greenwood B. Can malaria be eliminated? Trans R Soc Trop Med Hyg. 2009;103:S2–5. doi: 10.1016/j.trstmh.2008.10.027. - DOI - PubMed
    1. Maude RJ, Pontavornpinyo W, Saralamba S, Aguas R, Yeung S, Dondorp AM, Day NP, White NJ, White LJ. The last man standing is the most resistant: eliminating artemisinin-resistant malaria in Cambodia. Malar J. 2009;8:31. doi: 10.1186/1475-2875-8-31. - DOI - PMC - PubMed

Publication types