. 2010 Jul;58(1):162-71.
doi: 10.1016/j.eururo.2009.08.026. Epub 2009 Sep 4.

Human prostate fibroblasts induce growth and confer castration resistance and metastatic potential in LNCaP Cells

Affiliations

Human prostate fibroblasts induce growth and confer castration resistance and metastatic potential in LNCaP Cells

George N Thalmann et al. Eur Urol. 2010 Jul.

Abstract

Background: The tumor microenvironment is important for progressive and metastatic disease.

Objective: To study the hypothesis that prostate fibroblasts have differential ability to induce castration-resistant prostate cancer (PCa) and metastatic progression and whether this effect might vary depending on the zonal origin of the fibroblast.

Design, setting, and participants: Human prostate fibroblasts from the peripheral (PZ), transition (TZ) and central (CZ) zones of radical prostatectomy specimens (n=13) were isolated and compared for their ability to promote androgen independence and metastatic progression in androgen-responsive PCa lymph node carcinoma of the prostate (LNCaP) cells in vivo.

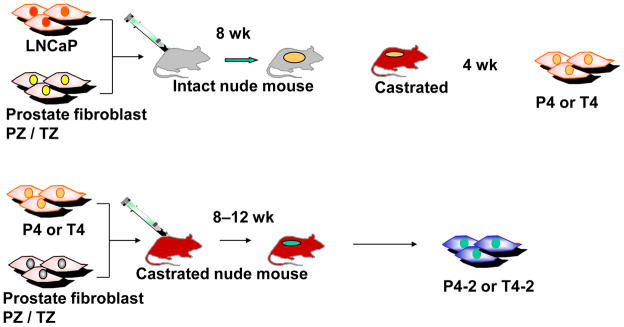
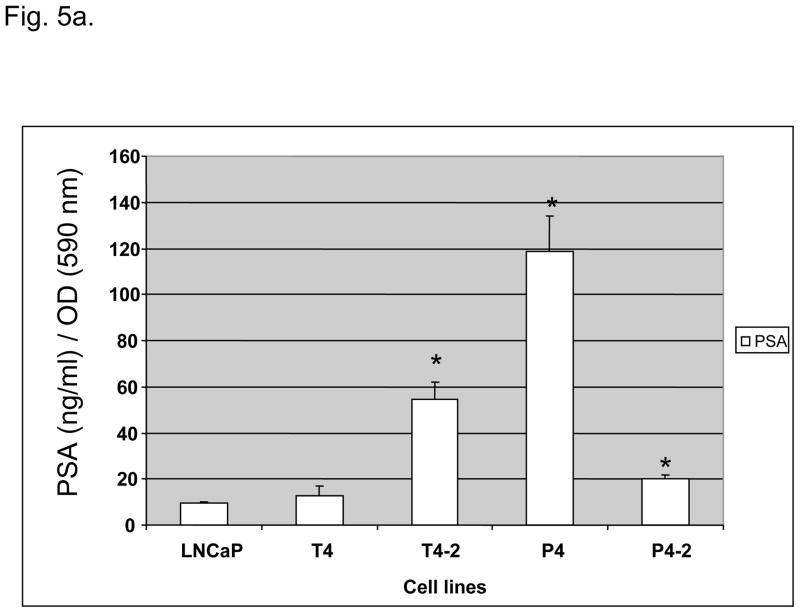
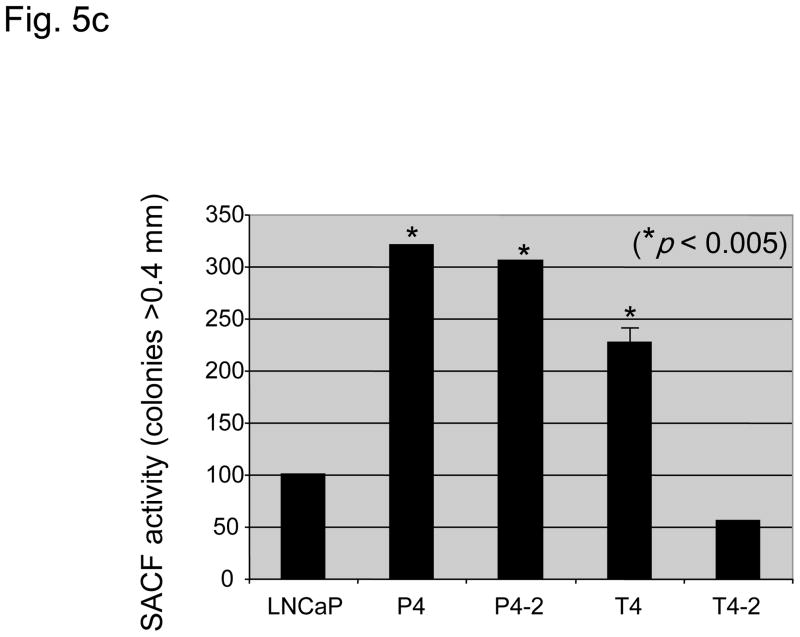
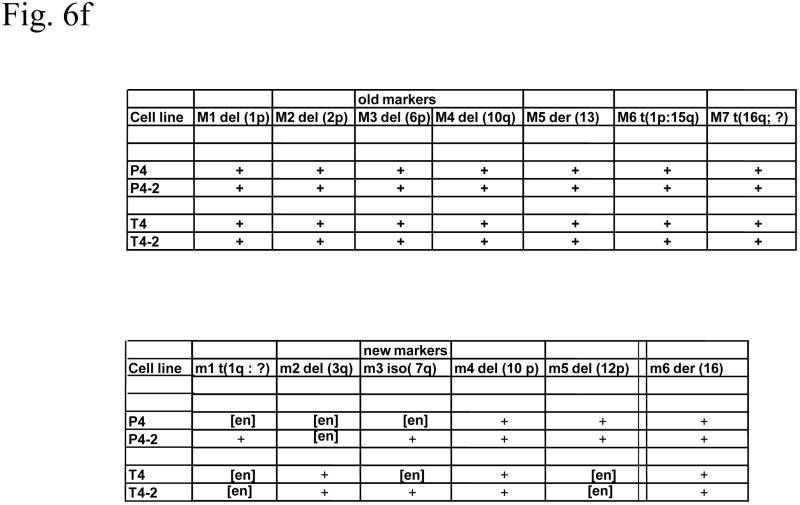
Interventions: By coinoculating marginally tumorigenic LNCaP cells with PZ or TZ and by altering host hormonal milieu, a series of tumorigenic and metastatic LNCaP epithelial sublines-P4, P4-2 (derivatives from interaction with PZ), T4, and T4-2 (derivatives from interaction with TZ)-were established and characterized.

Measurements: In vivo and in vitro evaluation of induction of tumor growth and metastatic potential.

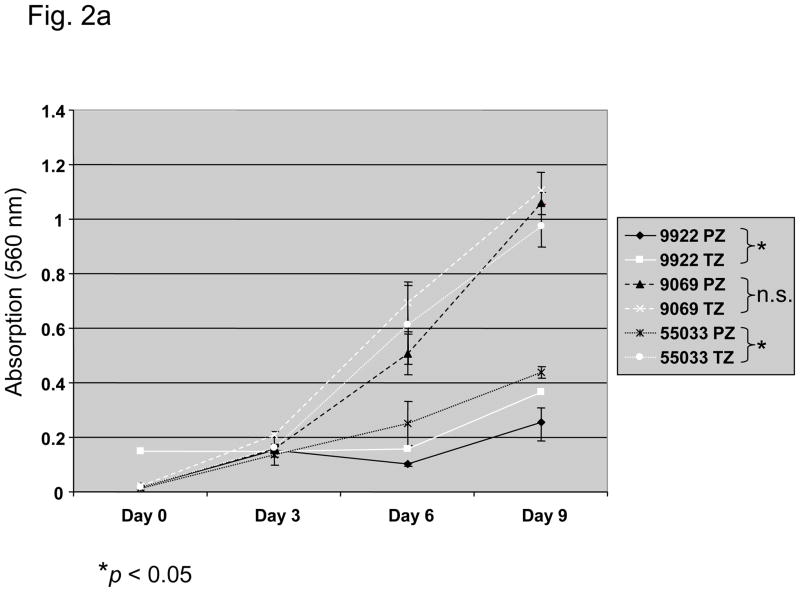
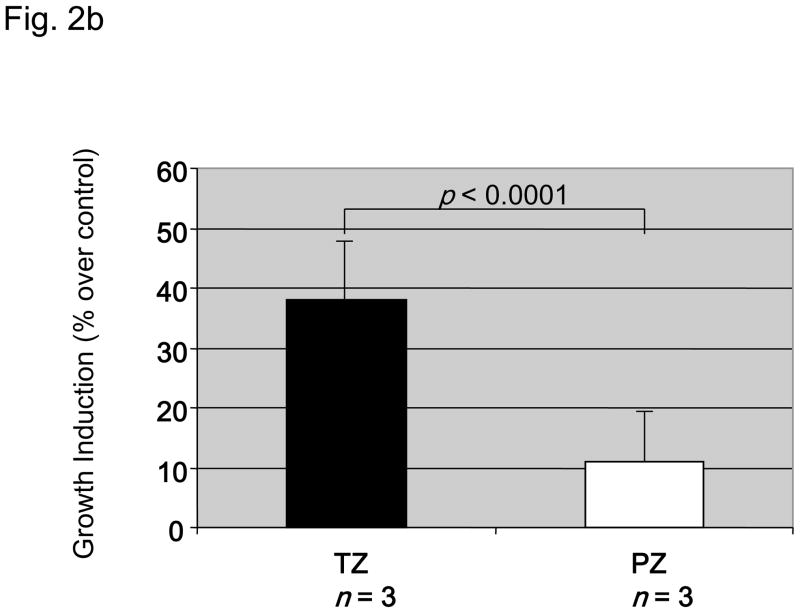
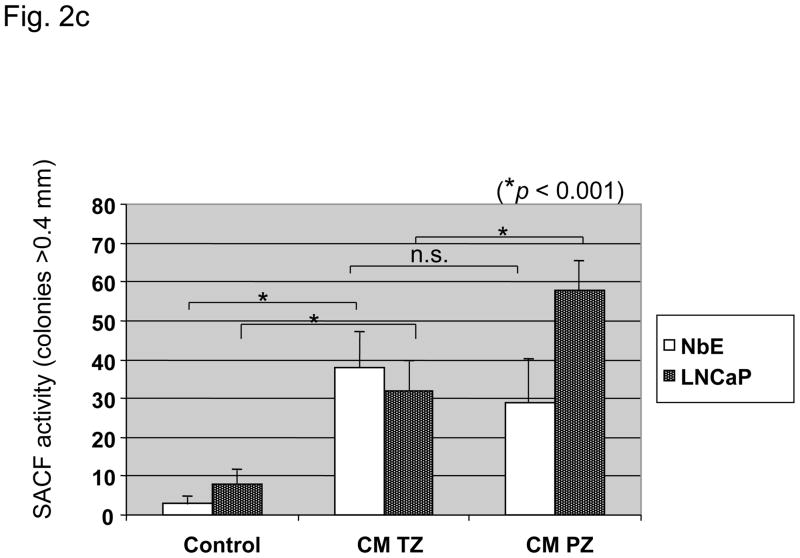
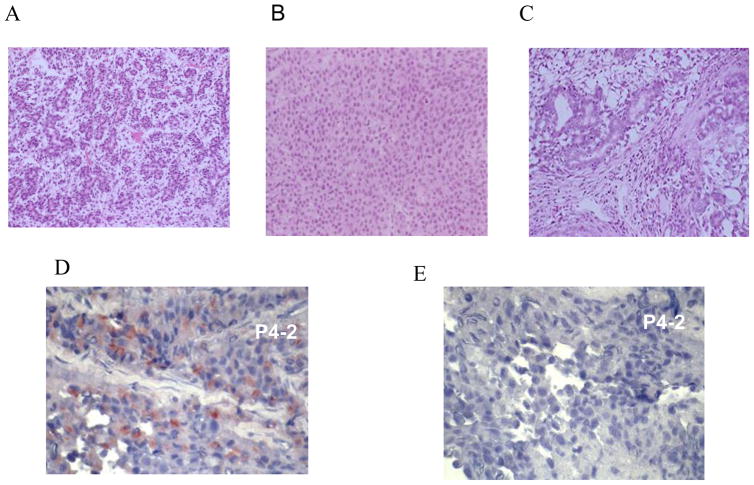
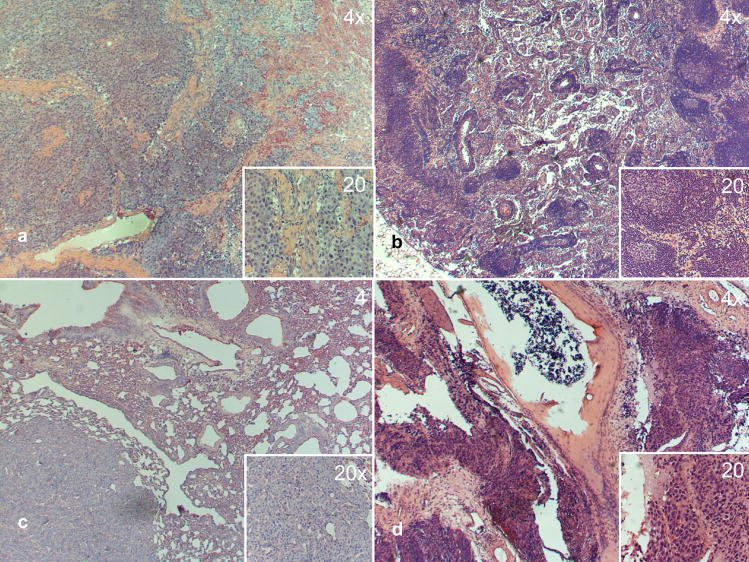
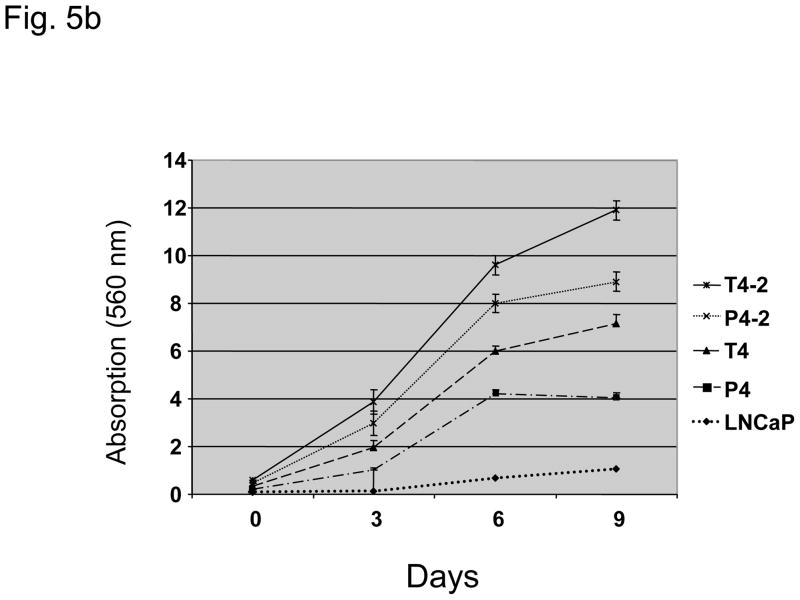
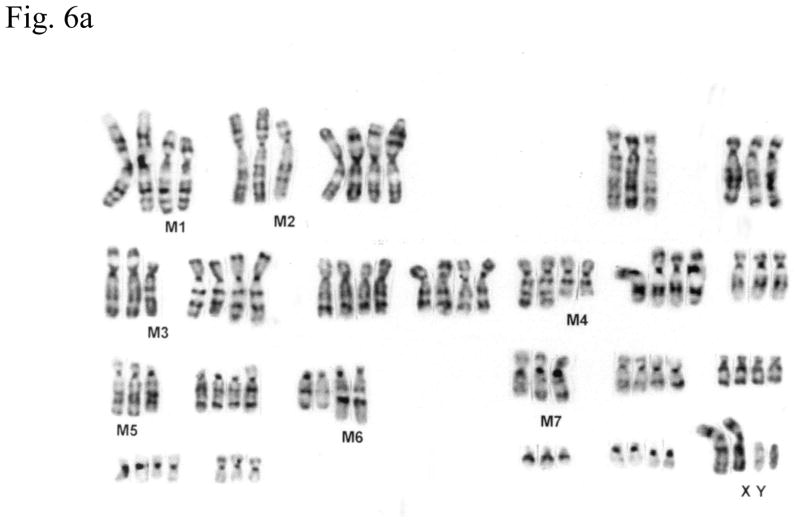
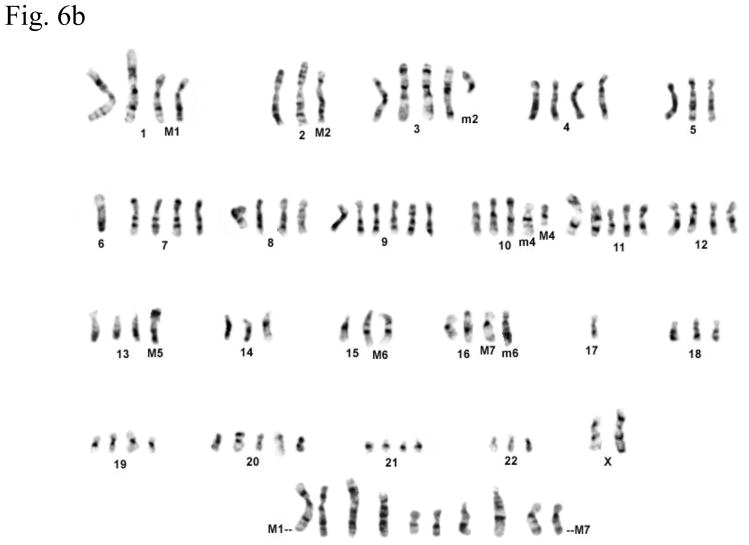
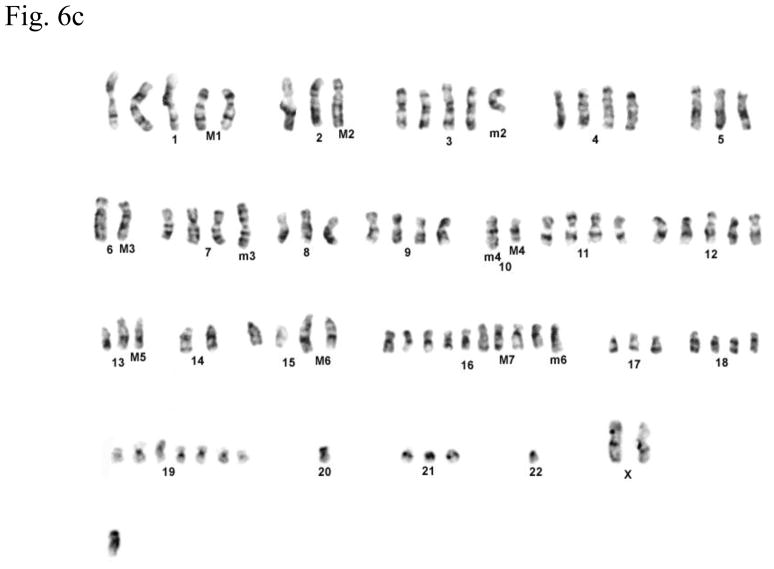
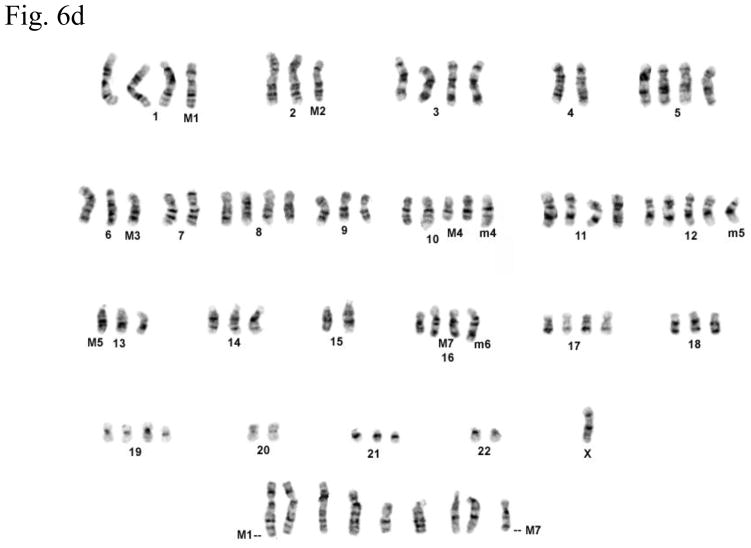
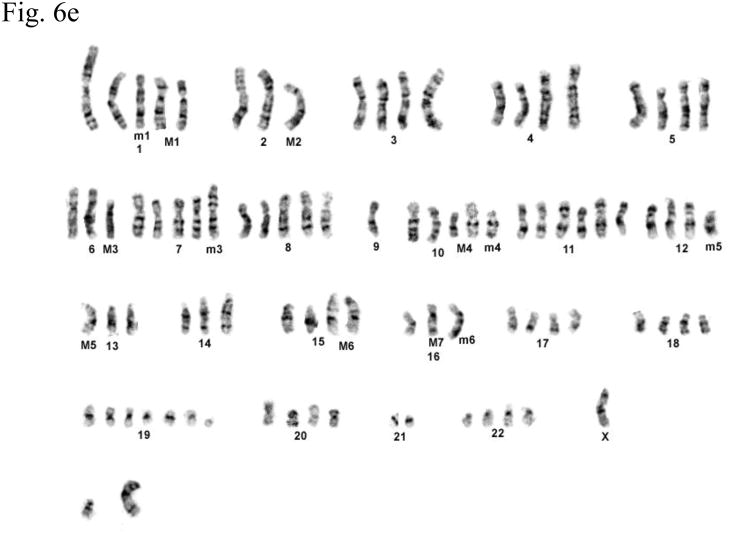
Results and limitations: 1) LNCaP sublines were permanently altered in their cytogenetic and biologic profiles after cellular interaction with prostate stromal fibroblasts. LNCaP sublines grew faster under anchorage-dependent and -independent conditions, expressed 1-12-fold more prostate-specific antigen in vitro than LNCaP cells, and gained metastatic potential; 2) zonal differences of stromal fibroblasts in their ability to induce the growth and progression of LNCaP tumors as xenografts in mice may exist but need further analysis; 3) PZ-conditioned medium induced more anchorage-independent growth of LNCaP cells in vitro. TZ had a higher growth rate and were more sensitive to dihydrotestosterone.

Conclusions: We demonstrate that prostate fibroblasts have growth inductive potential on PCa cells and affect their subsequent progression to castration resistance and development of a metastatic phenotype.


Figures

Fig. 1
Fig. 1
Scheme of the development of the different cell lines. PZ = peripheral zone; TZ = transition zone.
Fig. 2
Fig. 2
Characteristics of three paired fibroblast cell lines (9922PZ, 9922TZ, 90969PZ, 90969TZ, 55033PZ, 55033TZ) from the transition (TZ) and peripheral zone (PZ) of the prostate of three different patients. (a) Intrinsic in vitro growth curves of paired PZ- and TZ-derived cell lines derived from three patients over 9 d. Culture medium was changed on days 0, 3, and 6. Intrinsic growth of TZ fibroblasts was significantly (p < 0.05) faster than that of PZ fibroblasts in two of three patients, although in 9922 fibroblasts the difference was not large. (b) Dihydrotestosterone-induced growth in three PZ and three TZ fibroblast cell lines. TZ fibroblasts show a significantly (p < 0.0001) stronger growth induction by 1 nM dihydrotestosterone than PZ fibroblasts, expressed as percent over control. (c) In vitro clonogenic assay (soft agar colony formation): Effect of conditioned medium (CM) from three TZ and three PZ fibroblast cell lines on prostatic epithelial (NbE) and lymph node carcinoma of the prostate (LNCaP) cell anchorage-independent growth. PZ CM and TZ CM significantly (p < 0.001) induced anchorage-independent growth of NbE and LNCaP cells. Interestingly, LNCaP cells were significantly (p < 0.001) more sensitive to PZ CM. SACF = soft agarose colony formation.
Fig. 2
Fig. 2
Characteristics of three paired fibroblast cell lines (9922PZ, 9922TZ, 90969PZ, 90969TZ, 55033PZ, 55033TZ) from the transition (TZ) and peripheral zone (PZ) of the prostate of three different patients. (a) Intrinsic in vitro growth curves of paired PZ- and TZ-derived cell lines derived from three patients over 9 d. Culture medium was changed on days 0, 3, and 6. Intrinsic growth of TZ fibroblasts was significantly (p < 0.05) faster than that of PZ fibroblasts in two of three patients, although in 9922 fibroblasts the difference was not large. (b) Dihydrotestosterone-induced growth in three PZ and three TZ fibroblast cell lines. TZ fibroblasts show a significantly (p < 0.0001) stronger growth induction by 1 nM dihydrotestosterone than PZ fibroblasts, expressed as percent over control. (c) In vitro clonogenic assay (soft agar colony formation): Effect of conditioned medium (CM) from three TZ and three PZ fibroblast cell lines on prostatic epithelial (NbE) and lymph node carcinoma of the prostate (LNCaP) cell anchorage-independent growth. PZ CM and TZ CM significantly (p < 0.001) induced anchorage-independent growth of NbE and LNCaP cells. Interestingly, LNCaP cells were significantly (p < 0.001) more sensitive to PZ CM. SACF = soft agarose colony formation.
Fig. 3
Fig. 3
Representative panel of tumors injected subcutaneously induced by fibroblasts derived from different zones of the prostate. Histomorphologic analysis of tumors induced by human prostate fibroblasts revealed different morphologic patterns with some variation in tumors induced by different fibroblasts: (a) example of a small glandular growth pattern in the tumor induced by central zone (CZ) fibroblasts; (b) a more solid tumor growth with little stroma with transitional zone (TZ) fibroblasts; and (c) diffuse glandular growth with anaplastic features with peripheral zone (PZ) fibroblasts. Immunohistochemical staining for prostate-specific antigen (PSA) in consecutive sections of a P4-2 tumor. (d) Prostate-specific antigen (PSA) antibody (PSA expression red); (e) staining using isotype-specific immunoglobulin as control.
Fig. 4
Fig. 4
Representative panel of P4, P4-2, T4, T4-2 tumors and metastases (main image, ×4 magnification; insert ×20 magnification): (a) primary tumor P4, solid invasive growth with hypervascularization; (b) lymph node metastasis P4-2, glandular structures in the lymph node tissue; (c) nodular lung metastasis T4-2, solid; (d) bone metastasis P4-2 spinal column with destruction of cortical bone and periosteal growth of tumor cells. Bone metastases were mostly micrometastatic.
Fig. 5
Fig. 5
(A) Prostate-specific antigen (PSA) levels (nanograms per milliliter) of parental lymph node carcinoma of the prostate (LNCaP) cells and their derivative P and T sublines in relation to cell density (optical density [OD]: 590 nm). *PSA levels significantly increased in T4-2, P4, and P4-2 cells as compared to the parental LNCaP cell line (p < 0.05). (b) Intrinsic in vitro growth of LNCaP sublines as compared to the parental LNCaP cell line. Intrinsic growth rates increased with increased androgen-independence. (c) Clonogenic growth (soft agar colony formation assay) of LNCaP sublines as compared to the parental LNCaP cell line. Cell lines derived from the peripheral zone had a significant stronger anchorage-independent growth. SACF = soft agarose colony formation.
Fig. 5
Fig. 5
(A) Prostate-specific antigen (PSA) levels (nanograms per milliliter) of parental lymph node carcinoma of the prostate (LNCaP) cells and their derivative P and T sublines in relation to cell density (optical density [OD]: 590 nm). *PSA levels significantly increased in T4-2, P4, and P4-2 cells as compared to the parental LNCaP cell line (p < 0.05). (b) Intrinsic in vitro growth of LNCaP sublines as compared to the parental LNCaP cell line. Intrinsic growth rates increased with increased androgen-independence. (c) Clonogenic growth (soft agar colony formation assay) of LNCaP sublines as compared to the parental LNCaP cell line. Cell lines derived from the peripheral zone had a significant stronger anchorage-independent growth. SACF = soft agarose colony formation.
Fig. 6
Fig. 6
(a) G-banded karyotype of the parental lymph node carcinoma of the prostate (LNCaP) cell line. (b–e) Typical G-banded karyotypes and both types of marker chromosomes (M and m series) from (b) T4; (c) T 4-2; (d) P4; and (e) P4-2 cell lines, respectively. All cell lines are of human origin and have maintained marker chromosomes (M1-7) of the parental LNCaP cell line. Chromosome numbers range from 65 to 90 in all the four clones with a modal number of 88 for T4, 87 for T4-2, 83 for P4, and 90 for P4-2. Among the new markers (m1-6), only m4 and m6 are shared by all four cell lines; m3 is present only in P4-2 and T4-2; m5 is present in both P4 and P4-2 but is absent in T4 and T4-2. (f) Summary of old and new markers in the different cell lines. All marker chromosomes were identified based on their characteristic G-banding patterns and found to be clonal since they were present in more than two metaphases.
Fig. 6
Fig. 6
(a) G-banded karyotype of the parental lymph node carcinoma of the prostate (LNCaP) cell line. (b–e) Typical G-banded karyotypes and both types of marker chromosomes (M and m series) from (b) T4; (c) T 4-2; (d) P4; and (e) P4-2 cell lines, respectively. All cell lines are of human origin and have maintained marker chromosomes (M1-7) of the parental LNCaP cell line. Chromosome numbers range from 65 to 90 in all the four clones with a modal number of 88 for T4, 87 for T4-2, 83 for P4, and 90 for P4-2. Among the new markers (m1-6), only m4 and m6 are shared by all four cell lines; m3 is present only in P4-2 and T4-2; m5 is present in both P4 and P4-2 but is absent in T4 and T4-2. (f) Summary of old and new markers in the different cell lines. All marker chromosomes were identified based on their characteristic G-banding patterns and found to be clonal since they were present in more than two metaphases.

Comment in

References

    1. Jemal A, Murray T, Samuels A, et al. Cancer statistics. CA Cancer J Clin. 2003;53:5–26. - PubMed
    1. Joyce JA, Pollard JW. Microenvironmental regulation of metastasis. Nat Rev Cancer. 2009;9:239–52. - PMC - PubMed
    1. Gleave ME, Hsieh JT, von Eschenbach AC, Chung LW. Prostate and bone fibroblasts induce human prostate cancer growth in vivo: implications for bidirectional tumor-stromal cell interaction in prostate carcinoma growth and metastasis. J Urol. 1992;147:1151–9. - PubMed
    1. Thalmann GN, Anezinis PE, Chang SM, et al. Androgen-independent cancer progression and bone metastasis in the LNCaP model of human prostate cancer. Cancer Res. 1994;54:2577–81. - PubMed
    1. Thalmann GN, Sikes RA, Wu TT, et al. LNCaP progression model of human prostate cancer: androgen-independence and osseous metastasis. Prostate. 2000;44:91–103. - PubMed

Publication types

Substances