

Internally calibrated quantification of VEGF in human plasma by fluorescence immunoassays in disposable elastomeric microfluidic devices
- PMID: 19748324
- PMCID: PMC2818113
- DOI: 10.1016/j.jchromb.2009.08.038
Internally calibrated quantification of VEGF in human plasma by fluorescence immunoassays in disposable elastomeric microfluidic devices
Abstract
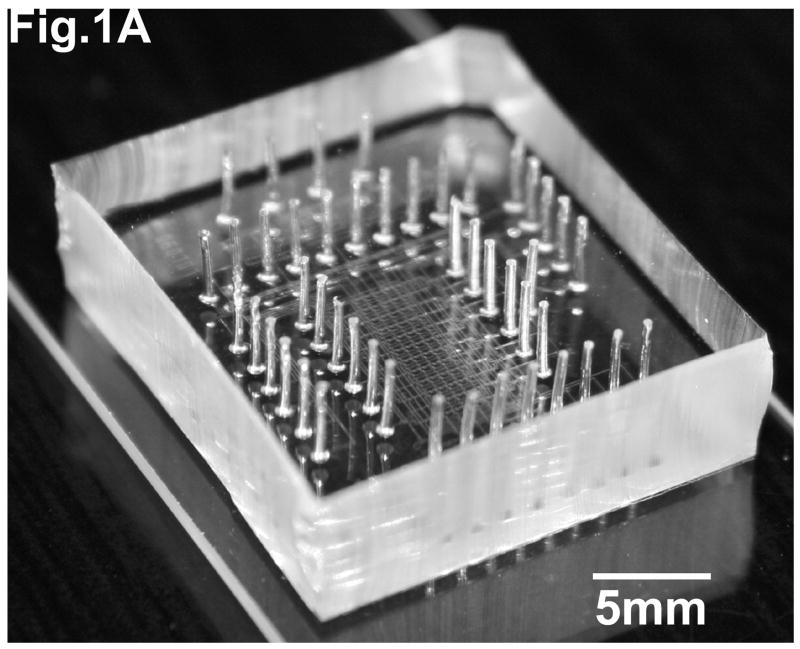
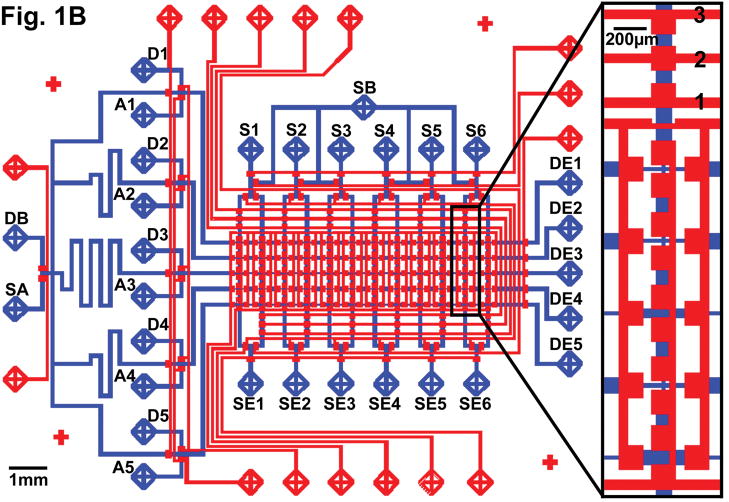
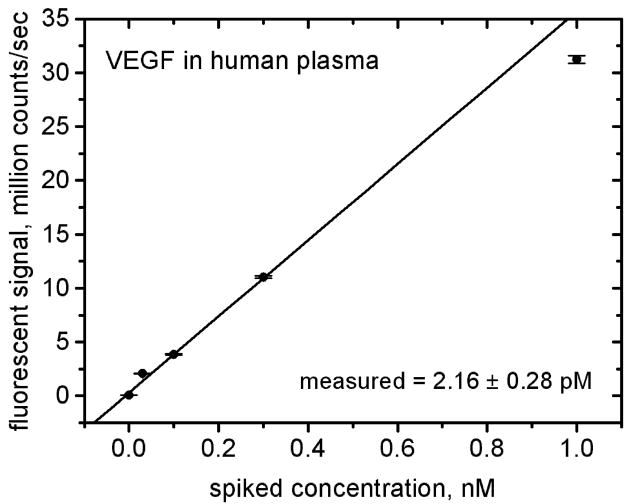
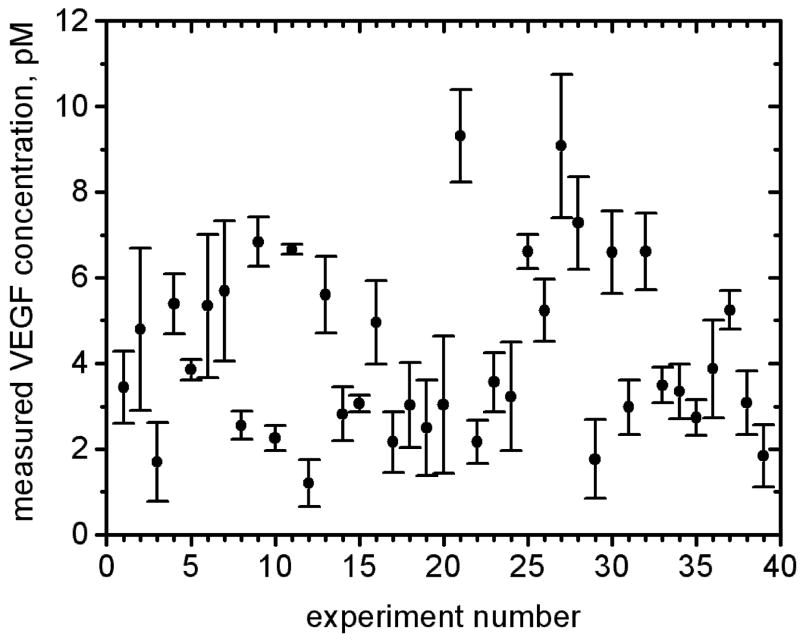
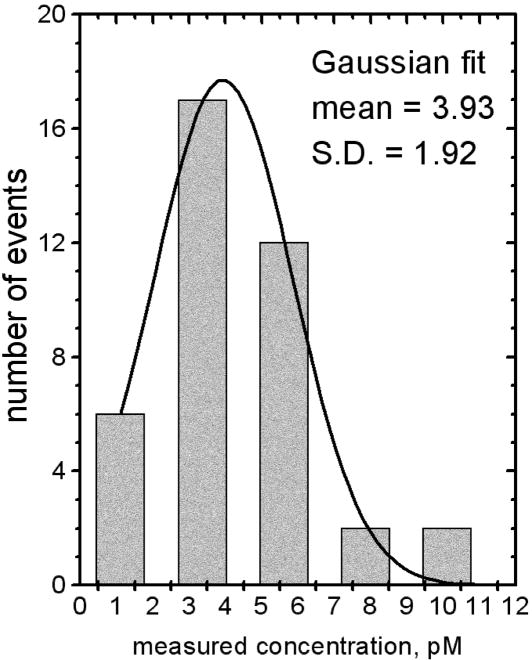
Herein we report on a proof of principle for the reproducible quantification of Vascular Endothelial Growth Factor (VEGF) in human plasma by fluorescence sandwich immunoassays using disposable polydimethylsiloxane (PDMS) microfluidic chips. The system requires 100 times less sample than typical clinical blood tests, while its current quantification limit is established at 4pM. The in-built calibration method of spiking the plasma with known concentrations of commercially available antigen avoids common sources of error and improves the reliability of the test results. The demonstrated technique is important for immunoassay applications in fundamental scientific research and "point-of-care" (POC) biomedical diagnostics. In particular, the system is immediately applicable to microfluidic quantification of VEGF in human plasma in cancer studies.
2009 Elsevier B.V. All rights reserved.
Figures
Similar articles
-
Internally calibrated quantification of protein analytes in human serum by fluorescence immunoassays in disposable elastomeric microfluidic devices.Electrophoresis. 2008 Dec;29(24):5010-6. doi: 10.1002/elps.200800297. Electrophoresis. 2008. PMID: 19130581 Free PMC article.
-
High-throughput multi-antigen microfluidic fluorescence immunoassays.Biotechniques. 2006 Jan;40(1):85-90. doi: 10.2144/000112071. Biotechniques. 2006. PMID: 16454045
-
Microfluidic chips for immunoassays.Annu Rev Anal Chem (Palo Alto Calif). 2013;6:119-41. doi: 10.1146/annurev-anchem-062012-092616. Epub 2013 Mar 14. Annu Rev Anal Chem (Palo Alto Calif). 2013. PMID: 23495732 Review.
-
Chemiluminescence immunoassay based on microfluidic chips for α-fetoprotein.Clin Chim Acta. 2014 Apr 20;431:113-7. doi: 10.1016/j.cca.2014.02.003. Epub 2014 Feb 12. Clin Chim Acta. 2014. PMID: 24530300
-
Immunoassays in microfluidic systems.Anal Bioanal Chem. 2010 Jun;397(3):991-1007. doi: 10.1007/s00216-010-3678-8. Epub 2010 Apr 27. Anal Bioanal Chem. 2010. PMID: 20422163 Review.
Cited by
-
Heterogeneous immunoassays in microfluidic format using fluorescence detection with integrated amorphous silicon photodiodes.Biomicrofluidics. 2011 Feb 15;5(1):14102. doi: 10.1063/1.3553014. Biomicrofluidics. 2011. PMID: 21403847 Free PMC article.
-
Miniaturized technology for protein and nucleic acid point-of-care testing.Transl Res. 2012 Nov;160(5):332-45. doi: 10.1016/j.trsl.2012.02.012. Epub 2012 Mar 11. Transl Res. 2012. PMID: 22683416 Free PMC article. Review.
-
A Solution to the Clearance Problem of Sacrificial Material in 3D Printing of Microfluidic Devices.Micromachines (Basel). 2022 Dec 21;14(1):16. doi: 10.3390/mi14010016. Micromachines (Basel). 2022. PMID: 36677077 Free PMC article.
-
Dimensional Fidelity and Orientation Effects of PolyJet Technology in 3D Printing of Negative Features for Microfluidic Applications.Micromachines (Basel). 2024 Mar 13;15(3):389. doi: 10.3390/mi15030389. Micromachines (Basel). 2024. PMID: 38542637 Free PMC article.
-
Applications of microfluidics for molecular diagnostics.Methods Mol Biol. 2013;949:305-34. doi: 10.1007/978-1-62703-134-9_20. Methods Mol Biol. 2013. PMID: 23329451 Free PMC article. Review.
References
-
- Gilbert HC, Szokol JW. Int Anesthesiol Clin. 2004;42(2):73. - PubMed
-
- Kartalov EP. J In-Vitro Diagnostics Technol. 2006 September;
-
- Wang J, Ibanez A, Chatrathi MP, Escarpa A. Anal Chem. 2001;73:5323. - PubMed
-
- Fruetel JA, Renzi RF, VanderNoot VA, Stamps J, et al. Electrophoresis. 2005;26:1144. - PubMed
-
- Angenendt P, Glockler J, Konthur Z, Lehrach H, Cahill DJ. Anal Chem. 2003;75:4368. - PubMed
Publication types
MeSH terms
Substances
Grants and funding
LinkOut - more resources
Full Text Sources
Other Literature Sources
