Comparative Study
. 2009 Dec 11:1302:106-17.
doi: 10.1016/j.brainres.2009.09.012. Epub 2009 Sep 11.

Sympathetic innervation of the spleen in male Brown Norway rats: a longitudinal aging study

Affiliations
Comparative Study

Sympathetic innervation of the spleen in male Brown Norway rats: a longitudinal aging study

Sam D Perez et al. Brain Res. .

Abstract

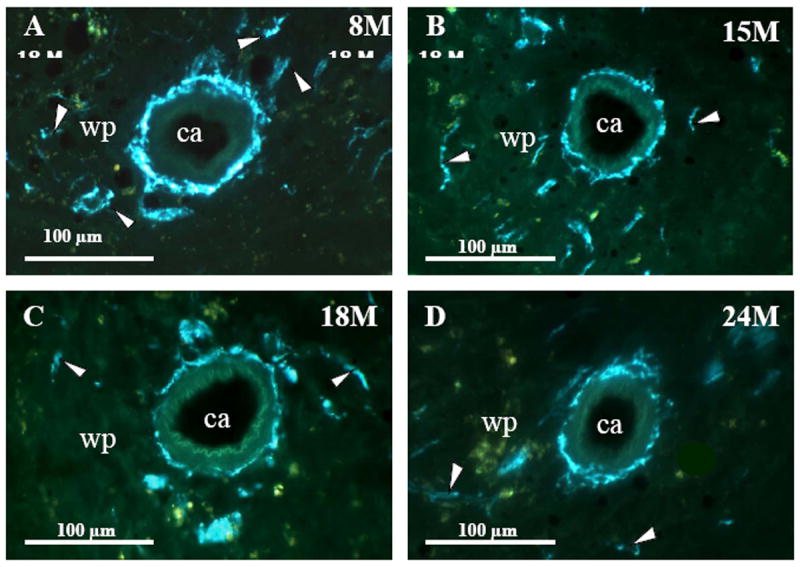
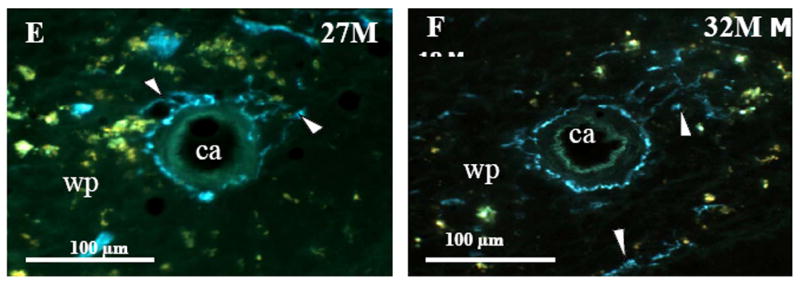
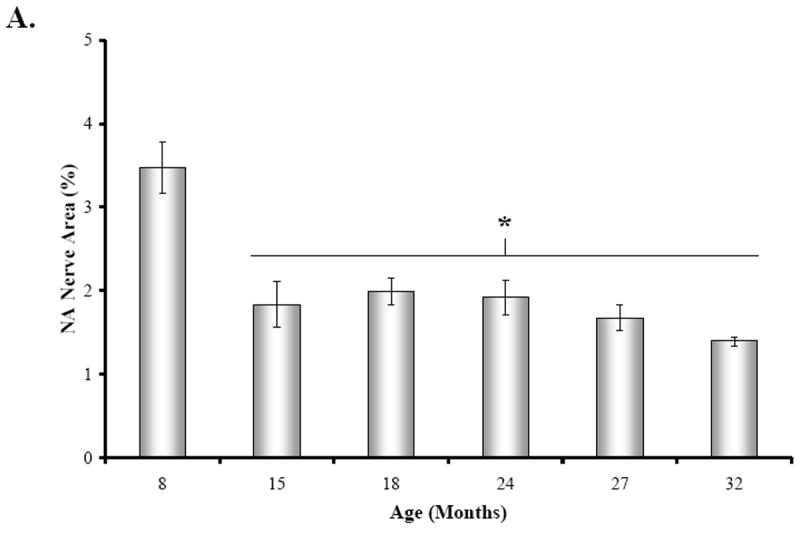
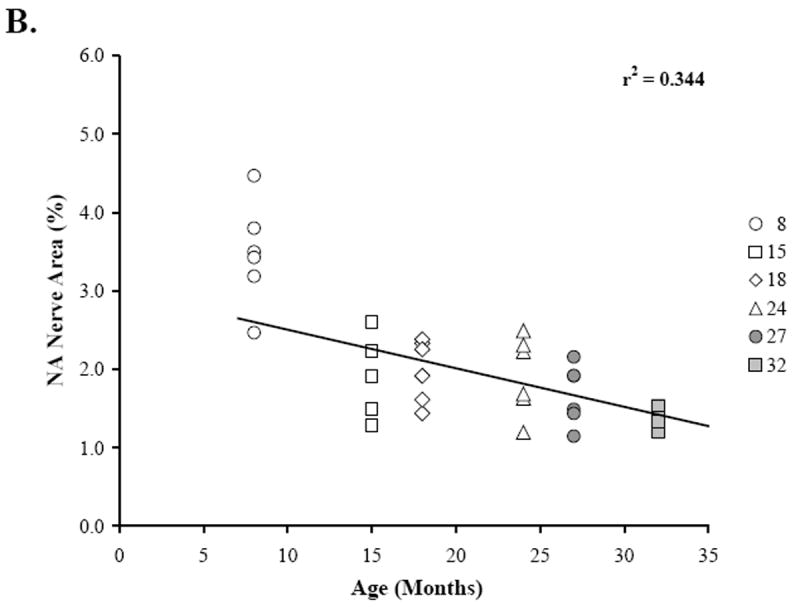
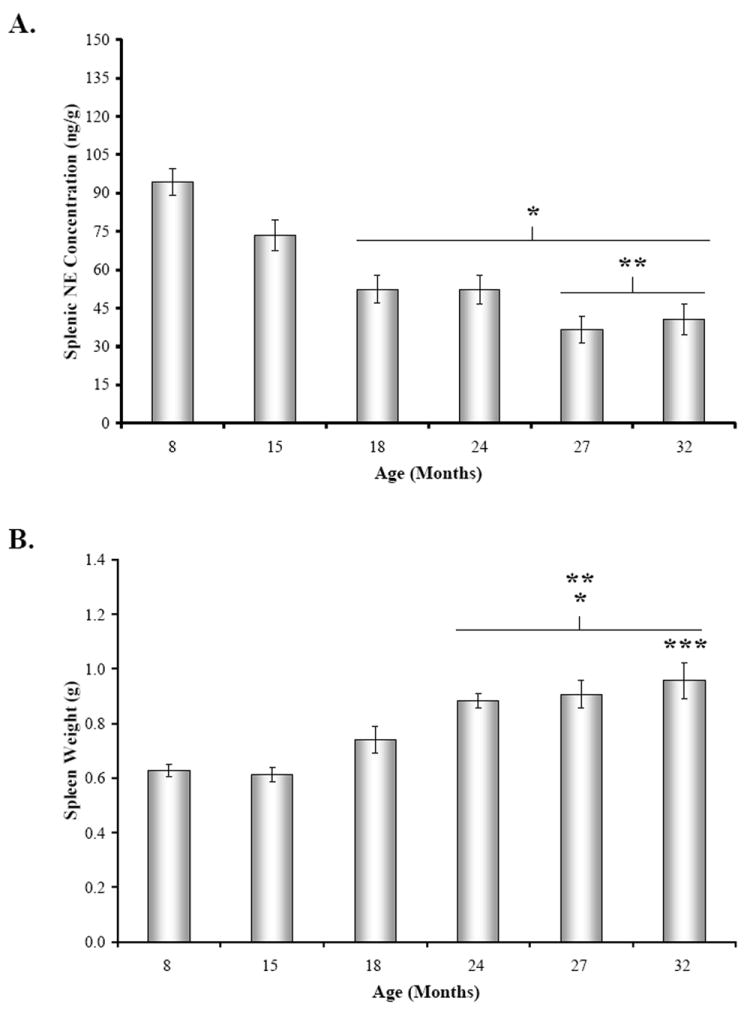
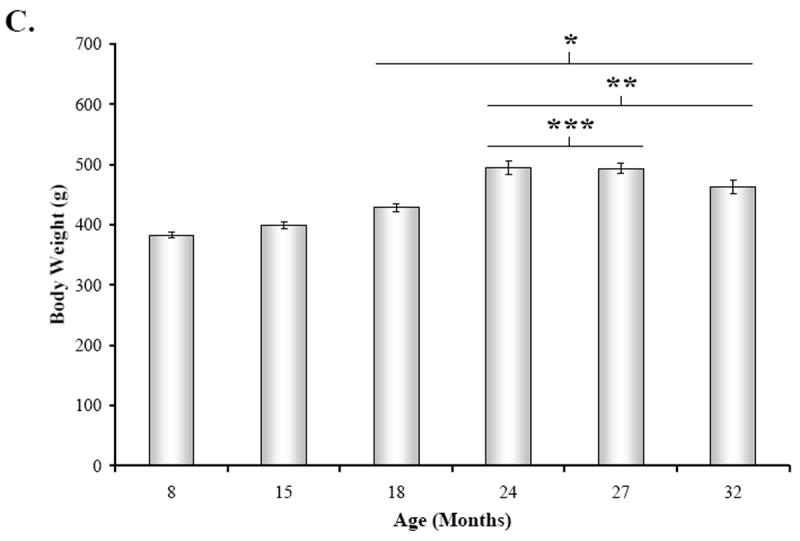
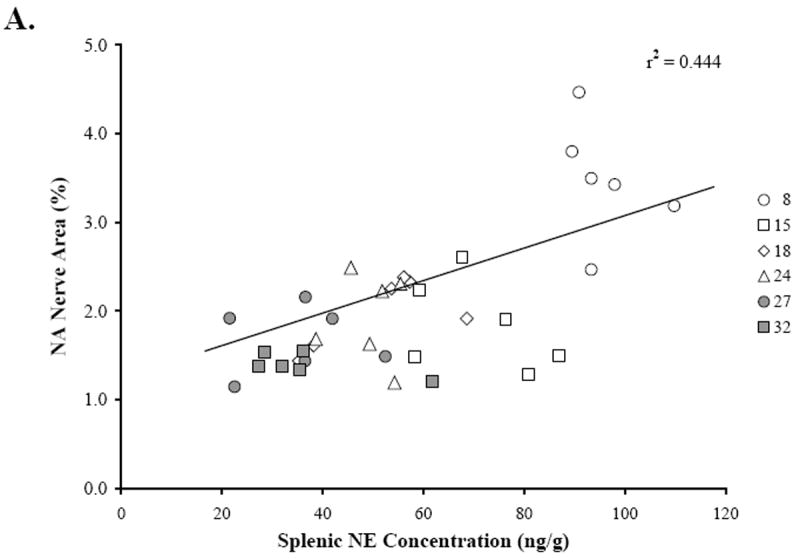
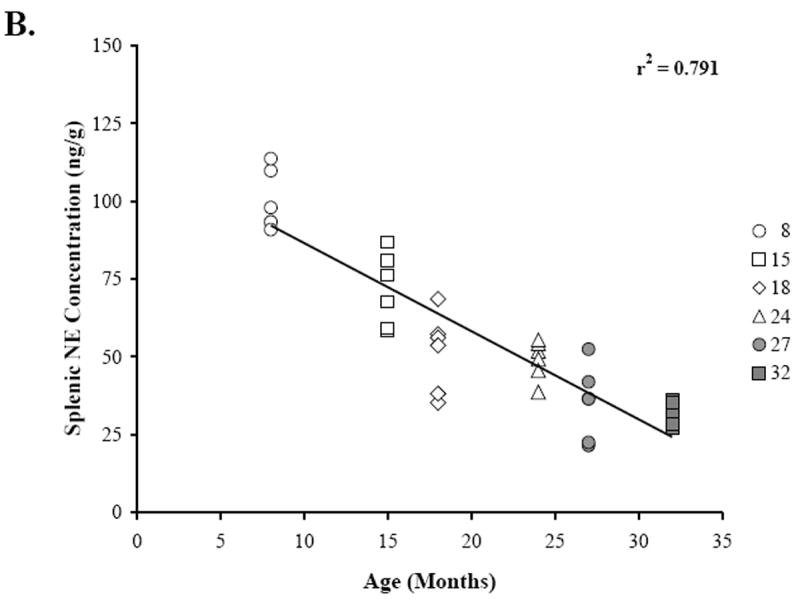
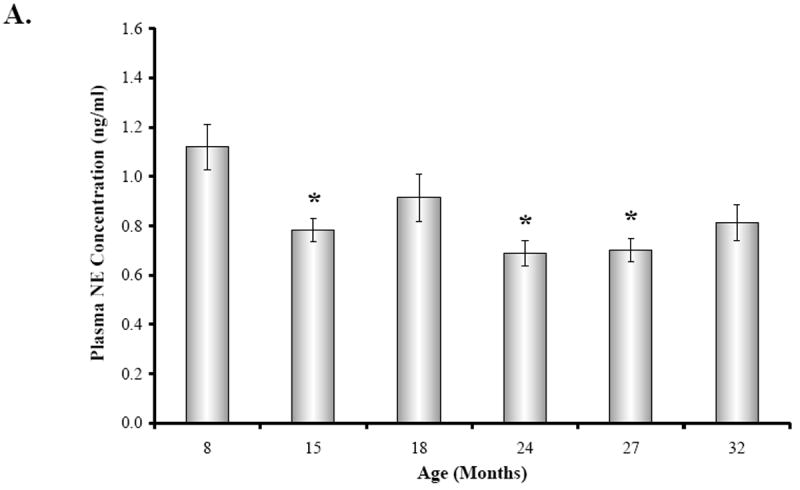
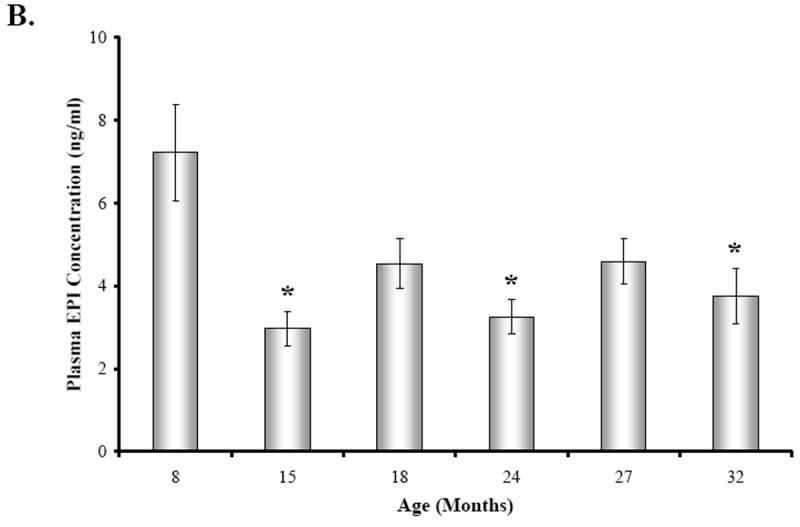
Aging leads to reduced cellular immunity with consequent increased rates of infectious disease, cancer, and autoimmunity in the elderly. The sympathetic nervous system (SNS) modulates innate and adaptive immunity via innervation of lymphoid organs. In aged Fischer 344 (F344) rats, noradrenergic (NA) nerve density in secondary lymphoid organs declines, which may contribute to immunosenescence with aging. These studies suggest there is SNS involvement in age-induced immune dysregulation. The purpose of this study was to longitudinally characterize age-related change in sympathetic innervation of the spleen and sympathetic activity/tone in male Brown Norway (BN) rats, which live longer and have a strikingly different immune profile than F344 rats, the traditional animal model for aging research. Splenic sympathetic neurotransmission was evaluated between 8 and 32 months of age by assessing (1) NA nerve fiber density, (2) splenic norepinephrine (NE) concentration, and (3) circulating catecholamine levels after decapitation. We report a decline in NA nerve density in splenic white pulp (45%) at 15 months of age compared with 8-month-old (M) rats, which is followed by a much slower rate of decline between 24 and 32 months. Lower splenic NE concentrations between 15 and 32 months of age compared with 8M rats were consistent with morphometric findings. Circulating catecholamine levels after decapitation stress generally dropped with increasing age. These findings suggest there is a sympathetic-to-immune system dysregulation beginning at middle age. Given the unique T-helper-2 bias in BN rats, altered sympathetic-immune communication may be important for understanding the age-related rise in asthma and autoimmunity.


Figures

Fig. 1
Fig. 1. NA Nerves in the Splenic White Pulp across Age
Fluorescence histochemistry for localizing catecholamines revealed a dense plexus of bluish-green fluorescent noradrenergic (NA) nerves surrounding the central arteriole (ca) and in the adjacent white pulp (wp; indicated by arrowheads) of spleens from 8M (A). In 15M (B) rats, NA innervation was diminished compared with 8M rats, a change that persisted through 32 months of age (C-F). These photographs are representative of NA innervation of spleens from all animals in each treatment group. 18M (C), 24M (D), 27M (E), and 32M (F) BN rats. Calibration bar = 100 μm.
Fig. 2
Fig. 2. Effect of Age on Mean Percentage of NA Nerve Area in the Splenic White Pulp
A. The mean percent area of noradrenergic (NA) nerves in splenic white pulps was significantly reduced (*, p < 0.0001) between 15 and 32 months of age. Four white pulp regions from 6 rats per age group were used to quantify nerve area and data are expressed as mean of mean ± SEM. B. A scatter plot demonstrates the distribution of splenic NA nerve expressed as a percentage of sample area in the white pulp across age expressed in months. The line of best fit shows that NA nerve area is negatively associated (r2 = 0.344; p < 0.0001) with age.
Fig. 3
Fig. 3. Mean Concentrations Splenic NE, Spleen Weight, and Body Weight across Age
A. Mean splenic norepinephrine (NE) concentration (expressed in ng/g tissue wet weight) was slightly lower, but not significantly different at 15 months of age compared with 8M rat. Between 18 and 32 months of age, splenic NE levels significantly (*, p < 0.001) decreased compared with 8M levels. Splenic NE concentrations from 27M and 32M rats also significantly differed (**, p < 0.01 and p < 0.01, respectively) from levels in 15M rats. B. Mean spleen weight (expressed in g) progressively rose between 8 and 32 months of age, with significant differences revealed by posthoc analysis in 24 through 32M rats compared with 8M and 15M rats (*, p < 0.01, 24M; p < 0.001, 27-32M and **, p < 0.001, respectively). Spleen weight also was significantly higher in 32M compared with 18M rats (***, p < 0.05). C. Mean body weights (expressed in g) were comparable at 8 and 15 months of age, but increased between 18 and 32 months of age. Error bars = SEM. *, significantly different from 8M: 18M, p < 0.01; 24 – 32M, p < 0.001; **, significantly different from 15M: 24 – 32M, p < 0.001; ***, significantly different from 18M: 24 – 27M, p < 0.001.
Fig. 4
Fig. 4. Relationship between Splenic NE Concentration and NA Nerve Area or Age
The scatter plots demonstrate the distribution of the mean percentage of NA nerve area in the white pulps that were sampled per rat across splenic NE concentration (ng/g) for each age group (A), and the distribution of splenic NE concentration (ng/g) across age (B). Linear regression analysis was used to plot the line of best fit and calculate r2, and reveals a positive association (p < 0.0001) between NA nerve area in the white pulp and splenic NE concentration (A) and a negative correlation between splenic NE concentration and increasing age (p < 0.0001) (B).
Fig. 5
Fig. 5. The Effect of Decapitation-Induced Stress on Plasma Catecholamine Content from Trunk Blood across Age
Plasma norepinephrine (NE) (A) and epinephrine (EPI) (B) concentrations (expressed in ng/ml as a mean ± SEM) in BN rats are shown across age (in months). A. Plasma NE concentrations were significantly (*, p < 0.05, p < 0.001, and p < 0.01, respectively) diminished at 15, 24, and 27 months of age compared with 8M rats. B. Similarly, plasma EPI levels were significantly (*, p < 0.01, 15 and 24M; p < 0.05, 32M) lower at 15, 24, and 32 months of age compared with 8M rats. Dashed boxes represent the range of basal catecholamines levels reported in the literature based on assessments from awake, undisturbed rats from which blood was drawn via an indwelling catheter ((Popper et al., 1977; Mabry et al 1995a,b,c; Paulose and Dakshinamurti, 1987; Carruba et al., 1981; Kvetnansky et al., 1978).

Similar articles

Cited by

References

    1. Bellinger DL, Silva D, Millar AB, Molinaro C, Ghamsary M, Carter J, Perez S, Lorton D, Lubahn C, Arauja G, Thyagarajan S. Sympathetic nervous system and lymphocyte proliferation in the Fischer 344 rat spleen: a longitudinal study. Neuroimmunomodulation. 2008a;15:260–271. - PubMed
    1. Bellinger DL, Millar BA, Perez S, Carter J, Wood C, Thyagarajan S, Molinaro C, Lubahn C, Lorton D. Sympathetic modulation of immunity: relevance to disease. Cell Immunol. 2008b;252:27–56. - PMC - PubMed
    1. Bellinger DL, Stevens SY, ThyagaRajan S, Lorton D, Madden KS. Aging and sympathetic modulation of immune function in Fischer 344 rats: effects of chemical sympathectomy on primary antibody response. J Neuroimmunol. 2005;165:21–32. - PubMed
    1. Bellinger D, Tran L, Kang J, Lubahn C, Felten D, Lorton D. Age-related changes in noradrenergic sympathetic innervation of the rat spleen are strain dependent. Brain Behav Immun. 2002;16:247–261. - PubMed
    1. Bellinger D, Lorton D, Lubahn C, Felten D. Innervation of lymphoid organs: association of nerves with cells of the immune system and their implications in disease. In: Ader R, Felten DL, Cohen N, editors. Psychoneuroimmunology. Academic Press; San Diego: 2001. pp. 55–111.

Publication types

MeSH terms