. 2010 Mar;209(1):136-41.
doi: 10.1016/j.atherosclerosis.2009.08.032. Epub 2009 Aug 21.

Computer-aided non-contrast CT-based quantification of pericardial and thoracic fat and their associations with coronary calcium and Metabolic Syndrome

Affiliations

Computer-aided non-contrast CT-based quantification of pericardial and thoracic fat and their associations with coronary calcium and Metabolic Syndrome

Damini Dey et al. Atherosclerosis. 2010 Mar.

Abstract

Introduction: Pericardial fat is emerging as an important parameter for cardiovascular risk stratification. We extended previously developed quantitation of thoracic fat volume (TFV) from non-contrast coronary calcium (CC) CT scans to also quantify pericardial fat volume (PFV) and investigated the associations of PFV and TFV with CC and the Metabolic Syndrome (METS).

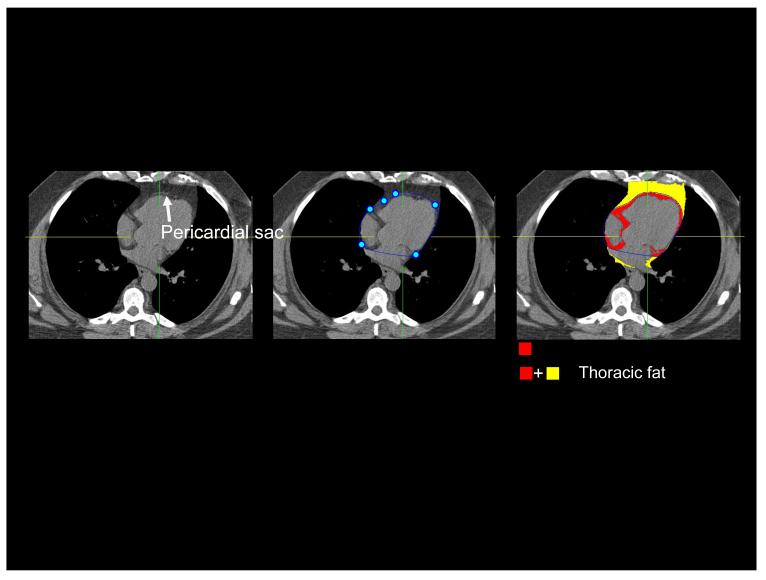
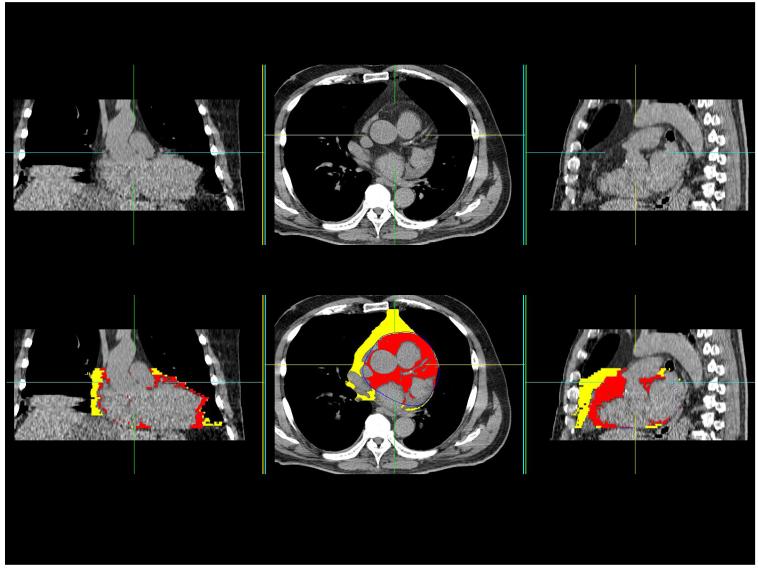
Methods: TFV is quantified automatically from user-defined range of CT slices covering the heart. Pericardial fat contours are generated by spline interpolation between 5-7 control points, placed manually on the pericardium within this cardiac range. Contiguous fat voxels within the pericardium are identified as pericardial fat. PFV and TFV were measured from non-contrast CT for 201 patients. In 105 patients, abdominal visceral fat area (VFA) was measured from an additional single-slice CT. In 26 patients, images were quantified by two readers to establish inter-observer variability. TFV and PFV were examined in relation to Body Mass Index (BMI), waist circumference and VFA, standard coronary risk factors (RF), CC (Agatston score >0) and METS.

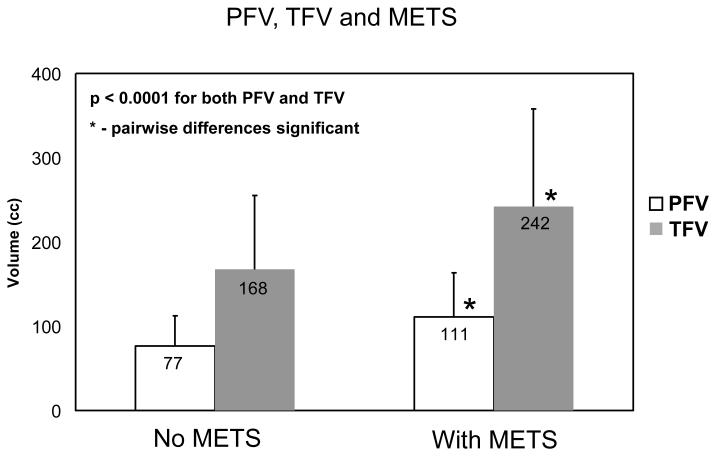
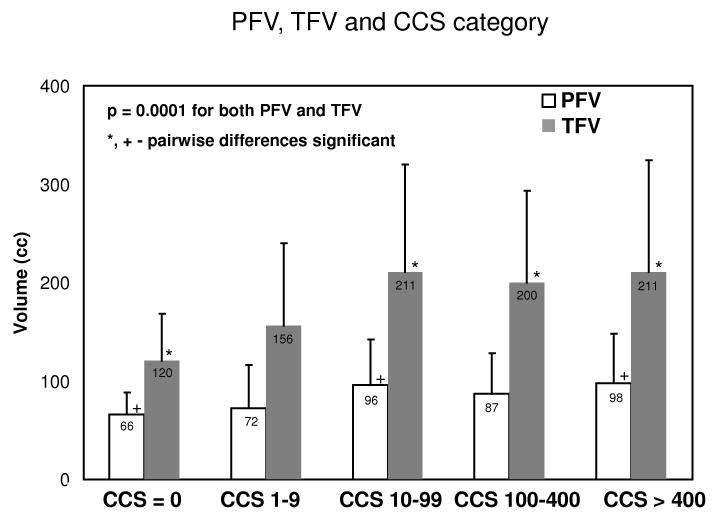
Results: PFV and TFV showed excellent correlation with VFA (R=0.79, R=0.89, p<0.0001), and moderate correlation with BMI (R=0.49, R=0.48, p<0.0001). In 26 scans, the inter-observer variability was greater for PFV (8.0+/-5.3%) than for TFV (4.4+/-3.9%, p=0.001). PFV and TFV, but not RF, were associated with CC [PFV: p=0.04, Odds Ratio 3.1; TFV: p<0.001, OR 7.9]. PFV and TFV were also associated with METS [PFV: p<0.001, OR 6.1; TFV p<0.001, OR 5.7], unlike CC [OR=1.0 p=NS] or RF. PFV correlated with low-HDL and high-glucose; TFV correlated with low-HDL, low-adiponectin, and high glucose and triglyceride levels.

Conclusions: PFV and TFV can be obtained easily and reproducibly from routine CC scoring scans, and may be important for risk stratification and monitoring.


Figures

Figure 1
Figure 1
(a) Figure illustrating pericardial and thoracic fat quantification for a 65-year old asymptomatic male patient from the EISNER study. Left: white arrow points to the pericardial sac as a thin band enveloping the heart. Middle: pericardial sac (closed curve in blue) is traced by an expert observer by placing 5-7 control points (shown as blue circles) on the pericardium. Right: Fat quantification results. Red overlay represents pericardial fat enclosed by the pericardium. Yellow overlay represents fat outside the pericardium. Color overlay (Red + Yellow) represents total thoracic fat. (b) CT study of a 71-year old male patient with a history of hypertension and no prior cardiovascular disease. Coronal, transverse and sagittal slices from the non-contrast CT scan are shown in top panel. Results of pericardial fat quantitation are shown in bottom panel. Red overlay represents pericardial fat enclosed by the pericardium. Yellow overlay represents thoracic fat outside the pericardium. PFV was 224 cm3 and TFV was 470 cm3.
Figure 1
Figure 1
(a) Figure illustrating pericardial and thoracic fat quantification for a 65-year old asymptomatic male patient from the EISNER study. Left: white arrow points to the pericardial sac as a thin band enveloping the heart. Middle: pericardial sac (closed curve in blue) is traced by an expert observer by placing 5-7 control points (shown as blue circles) on the pericardium. Right: Fat quantification results. Red overlay represents pericardial fat enclosed by the pericardium. Yellow overlay represents fat outside the pericardium. Color overlay (Red + Yellow) represents total thoracic fat. (b) CT study of a 71-year old male patient with a history of hypertension and no prior cardiovascular disease. Coronal, transverse and sagittal slices from the non-contrast CT scan are shown in top panel. Results of pericardial fat quantitation are shown in bottom panel. Red overlay represents pericardial fat enclosed by the pericardium. Yellow overlay represents thoracic fat outside the pericardium. PFV was 224 cm3 and TFV was 470 cm3.
Figure 2
Figure 2
(a) Correlation of CT-measured (a) pericardial fat volume (PFV) and (b) thoracic fat volume (TFV) with abdominal visceral fat area (VFA) (N=105). (b) PFV and TFV for patients with and without coronary calcium (p=0.006). Pairwise differences were significant for both. (c) PFV and TFV for patients with and without METS (p<0.0001). Pairwise differences were significant for both.
Figure 2
Figure 2
(a) Correlation of CT-measured (a) pericardial fat volume (PFV) and (b) thoracic fat volume (TFV) with abdominal visceral fat area (VFA) (N=105). (b) PFV and TFV for patients with and without coronary calcium (p=0.006). Pairwise differences were significant for both. (c) PFV and TFV for patients with and without METS (p<0.0001). Pairwise differences were significant for both.
Figure 3 (appendix)
Figure 3 (appendix)
PFV and TFV for coronary calcium score categories (p = 0.0001 from ANOVA analysis). Significant pairwise differences are shown by + for PFV and by * for TFV.

References

    1. Iacobellis G, Pistilli D, Gucciardo M, Leonetti F, Miraldi F, Brancaccio G, Gallo P, di Gioia CR. Adiponectin expression in human epicardial adipose tissue in vivo is lower in patients with coronary artery disease. Cytokine. 2005 Mar 21;29(6):251–255. - PubMed
    1. Kortelainen ML. Myocardial infarction and coronary pathology in severely obese people examined at autopsy. Int J Obes Relat Metab Disord. 2002 Jan;26(1):73–79. - PubMed
    1. Rosito GA, Massaro JM, Hoffmann U, Ruberg FL, Mahabadi AA, Vasan RS, O’Donnell CJ, Fox CS. Pericardial Fat, Visceral Abdominal Fat, Cardiovascular Disease Risk Factors, and Vascular Calcification in a Community-Based Sample: The Framingham Heart Study. Circulation. 2008 February 5;117(5):605–613. 2008. - PubMed
    1. Gorter PM, van Lindert ASR, de Vos AM, Meijs MFL, van der Graaf Y, Doevendans PA, Prokop M, Visseren FLJ. Quantification of epicardial and peri-coronary fat using cardiac computed tomography; reproducibility and relation with obesity and metabolic syndrome in patients suspected of coronary artery disease. Atherosclerosis. 2008;197(2):896–903. - PubMed
    1. Ding J, Kritchevsky SB, Harris TB, Burke GL, Detrano RC, Szklo M, Carr J Jeffrey. The Association of Pericardial Fat With Calcified Coronary Plaque. Obesity. 2008;16(8):1914–1919. - PMC - PubMed

Publication types