. 2009 Nov;21(11):1277-89.
doi: 10.1093/intimm/dxp094. Epub 2009 Sep 11.

Naive CD4 T cells from aged mice show enhanced death upon primary activation

Affiliations

Naive CD4 T cells from aged mice show enhanced death upon primary activation

Hamid Mattoo et al. Int Immunol. 2009 Nov.

Abstract

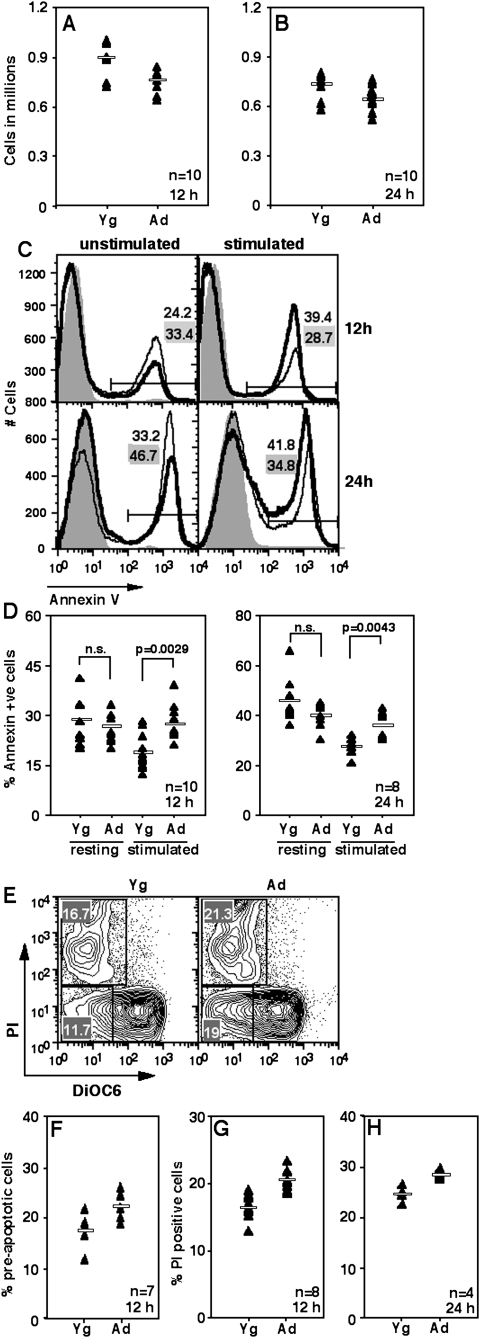
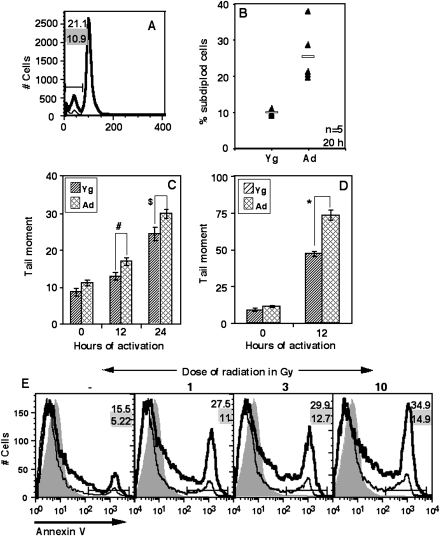
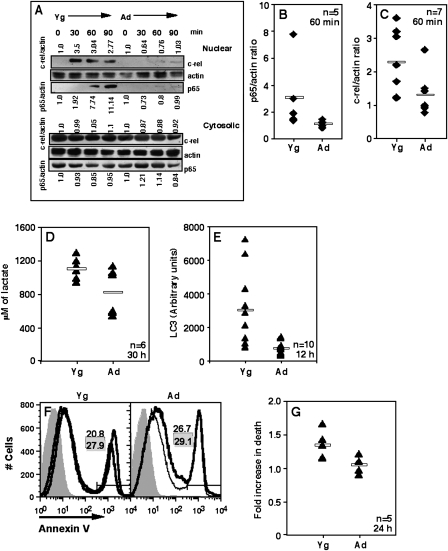
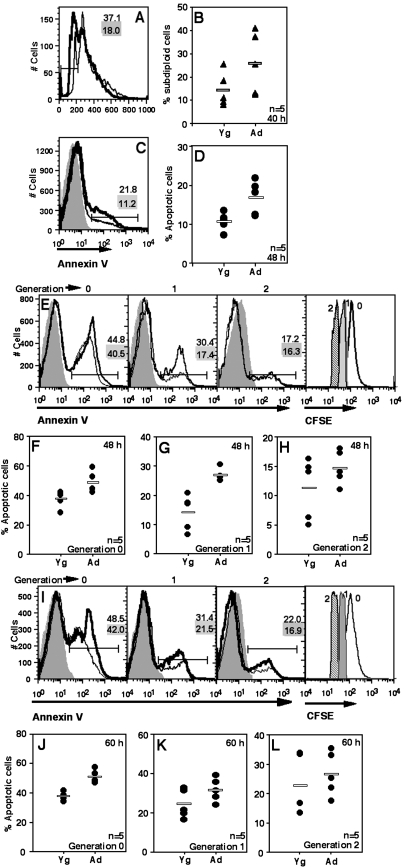
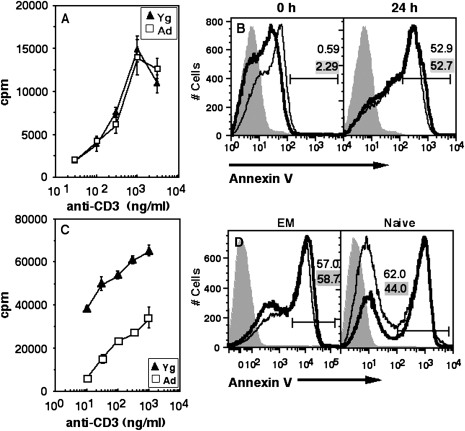
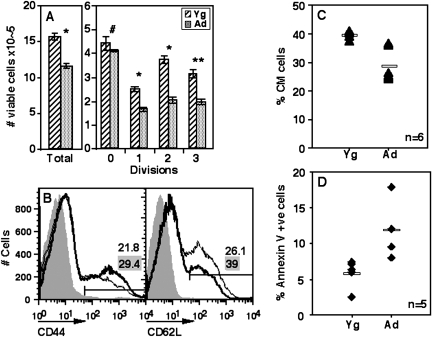
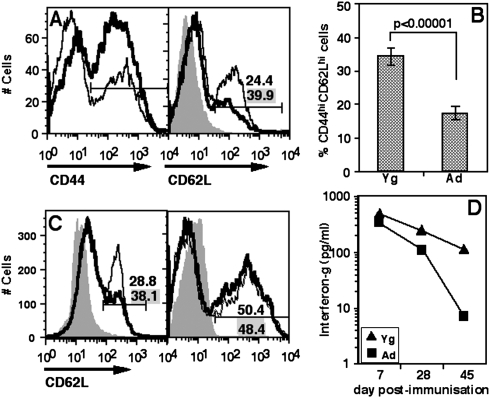
Poor T cell immunity is one of the many defects seen in elderly humans and aged (Ad) mice. We report that naive CD4 T cells from aged mice (ANCD4 cells) showed greater apoptosis upon primary activation than those from young (Yg) mice, with loss of mitochondrial membrane potential, poor activation of Rel family transcription factors and increased DNA damage. Their ability to enhance glycolysis, produce lactate and induce autophagy following activation was also compromised. ANCD4 cells remained susceptible to death beyond first cell division. Activated ANCD4 cells also showed poor transition to a 'central memory' (CM) CD44(high), CD62L(high) phenotype in vitro. This correlated with low proportions of CM cells in Ad mice in vivo. Functionally, too, IFN-gamma responses recalled from T cells of immunized Ad mice, poor to begin with, worsened with time as compared with Yg mice. Thus, ANCD4 cells handle activation-associated stress very poorly due to multiple defects, possibly contributing to poor formation of long-lasting memory.


Figures

Fig. 1.
Fig. 1.
Ad naive CD4 T cells die more on activation. (A and B) Trypan blue-negative cell counts in anti-CD3+anti-CD28-stimulated naive CD4 cells at 12 (A) or 24 h (B) of culture. (A) P = 0.004; (B): P = 0.0087 by Mann–Whitney test. Horizontal line in each panel depicts the mean value; n as indicated. (C) Proportions of annexin V-binding cells from unstimulated (left panels) and stimulated (right panels) NCD4 cell cultures at 12 (top panels) and 24 h (bottom panels).Thin line: Yg cells; thick line: Ad cells. Shaded histogram, negative control. Numbers with grey backgrounds show proportions of cells from YNCD4 cultures and those with white backgrounds from ANCD4 cultures. (D) Pooled data as in C from 8–10 experiments showing proportions of annexin V-binding cells from Yg and Ad mice in resting (unstimulated) and stimulated cultures at 12 (left panel) and 24 h (right panel). P values as shown by Mann–Whitney test; n.s. = not significant. Horizontal line in each panel depicts the mean value; n as indicated. (E) Staining profiles of DiOC6- and PI-labelled YNCD4 (left panel) and ANCD4 (right panel) cells 12 h post-activation. Numbers in various quadrants indicate percentages. (F) Proportions of DiOC6low, PI pre-apoptotic cells from cultures 12 h post-activation. P = 0.0102 by Mann–Whitney test; n as indicated. Horizontal line depicts mean value. (G and H) Proportions of DiOC6low, PI+ cells from stimulated cultures at 12 (G) and 24 h (H) post-activation. (G): P = 0.0008 and (H): P = 0.05 by Mann–Whitney test; n as indicated. Horizontal line depicts mean value.
Fig. 2.
Fig. 2.
Ad naive CD4 T cells show more subdiploidy and defective DNA repair post-activation. (A) A representative analysis of DNA content of stimulated YNCD4 and ANCD4 cells after 20 h in culture. Subdiploid population is marked in PI-stained cells. Numbers with grey background are for Yg cells, and those with white background for Ad cells. (B) Percentages of subdiploid cells from stimulated YNCD4 and ANCD4 cultures are shown. P = 0.006 by Mann–Whitney test; n as indicated. Horizontal line depicts mean value. (C and D) Comparison of ANCD4 and YNCD4 cells activated with anti-CD3+anti-CD28 (C) or irradiated (3 Gy) (D) and scored for tail moment over indicated period (mean ± SEM, n = 30–60 cells, #P = 0.0048, $P = 0.0126, *P = 0.0000 by Student's t-test). (E) ANCD4 and YNCD4 cells, irradiated with indicated doses or left unirradiated, were activated with anti-CD3+anti-CD28 and 12 h post-activation and stained with anti-CD69 and annexin V. Comparison of annexin V binding in gated CD69-expressing cells is shown. Thin line: Yg cells; thick line: Ad cells. Data are representative of two independent experiments. Numbers with grey background are for Yg cells, and those with white background for Ad cells.
Fig. 3.
Fig. 3.
ANCD4 cells show defects in NF-κB induction, metabolism and autophagy. (A) Western blot showing poor nuclear translocation of p65 and c-Rel in activated ANCD4 as compared with YNCD4 cells. Nuclear (top) and cytoplasmic (bottom) levels at various times post-activation as shown. Normalized ratios for p65/actin and c-Rel/actin shown below and above each cluster of western blots, respectively. Zero-hour ratio for each set designated as 1. Data are representative of five to seven independent experiments. (B and C) Fold enhancement in signal as p65/actin (B) and c-Rel/actin (C) ratios in the nuclear extracts of 60-min-activated ANCD4 and YNCD4 cells. (B): P = 0.0107 and (C): P = 0.0207 by Mann–Whitney test; n as indicated. Horizontal line depicts mean value. (D) Levels of lactate in cultures from ANCD4 and YNCD4 cells 30 h post-activation. P = 0.0465 by Mann–Whitney test; n as indicated. Values of lactate at 0 h: Yg 822.7 ± 31.44 and Ad 841.15 ± 48.62 μM (mean ± SEM). Horizontal line depicts mean value. (E) ANCD4 and YNCD4 cells were activated for 12 h and intensity of LC3 staining around autophagosomal vacuoles was estimated by quantitative fluorescence microscopy. P = 0.0014 by Mann–Whitney test; n as indicated. Intensity at 0 h: Yg 881.7 ± 184.7 and Ad 1132.49 ± 155.28 (mean ± SEM, n = 10). Horizontal line depicts mean value. (F) Annexin V staining of YNCD4 and ANCD4 cells stimulated for 24 h in the presence (thin line) or absence (thick line) of 1 mM 3-MA. Shaded histogram, negative control. Proportions in the absence (white background) or presence (grey background) of 3-MA shown as numbers in each panel. Data are representative of five independent experiments. (G) Fold increase in death in the presence of 3-MA 24 h post-activation. Data shown as % death in the presence of 3-MA/% death in the absence of 3-MA. P = 0.0183 by Mann–Whitney test; n as indicated.
Fig. 4.
Fig. 4.
ANCD4 cells continue to die at higher frequency for some successive generations. (A) A representative profile of ANCD4 and YNCD4 cells 40 h post-activation to show subdiploid cells using post-permeabilization PI staining. Numbers with grey background are for Yg cells; numbers with white background are for Ad cells. (B) Data from five independent experiments as in (A) above showing proportions of subdiploid cells from ANCD4 and YNCD4 cultures. P = 0.0475 by Mann–Whitney test. Horizontal line depicts mean value. (C) ANCD4 and YNCD4 cells were activated for 48 h and death scored in CD44high cells by annexin V. Thin line: YNCD4; thick line: ANCD4. Numbers with grey background are for YNCD4; numbers with white background are for ANCD4. (D) Percentages of apoptotic cells from five independent experiments in CD44high ANCD4 and YNCD4 cells at 48 h post-activation. P = 0.0183 by Mann–Whitney test. Horizontal line depicts mean value. (E–L) After activation for 48 (E, F, G, H) or 60 h (I, J, K, L), successive cell generations were gated in CFSE-labelled ANCD4 and YNCD4 cells, and the proportions of annexin V-positive cells in each cell generation estimated. Representative histograms are shown (E, I); thin line: YNCD4; thick line: ANCD4. Numbers with grey background are for YNCD4; numbers with white background are for ANCD4. Representative CFSE profiles of populations in generation 0, 1 and 2 are shown in the rightmost panels in (E) and (I). Proportions of apoptotic cells in generations 0, 1 and 2 at 48 (F, G, H) and 60 h (J, K, L) are shown. (F): P = 0.0107; (G): P = 0.006; (H): P = 0.2643; (J): P = 0.006 and (K): P = 0.0869; (L): P = 0.2 by Mann–Whitney test; n as indicated. Horizontal line depicts mean value.
Fig. 5.
Fig. 5.
Ad and Yg CD4 T cell blasts and EM cells ex vivo show comparable susceptibility to activation-induced death. (A) Ad and Yg CD4 T cell blasts recovered 96 h post-activation by Ficoll separation were re-stimulated with titrating doses of anti-CD3. Proliferation was measured by [3H]thymidine incorporation (mean ± SEM of triplicate cultures). (B) Cells re-stimulated as in (A) above were scored at 0 and 24 h post-activation for annexin V staining. Shaded curve: negative control; thin line: Yg; thick line: Ad. Numbers in grey background are for Yg, and those in white background are for Ad. (C) Response of MACS-purified ex vivo EM cells from Yg and Ad mice to titrating doses of anti-CD3. Proliferation was measured by [3H]thymidine incorporation (mean ± SEM of triplicate cultures). (D) MACS-purified EM (left) and naive (right) cells were activated for 48 h and death was scored by annexin V. Shaded curve: negative control; thin line: Yg; thick line: Ad.
Fig. 6.
Fig. 6.
ANCD4 cells show poor generation of the CM phenotype in vitro. (A) Total number of viable cells (left panel) and viable cells in each division from CFSE-labelled activated YNCD4 and ANCD4 cell cultures at 60 h (right panel). Mean ± SEM, n = 3. *P < 0.005, **P < 0.01, #P > 0.05. (B) CD44 staining in activated YNCD4 and ANCD4 cells at 48 h (left panel). CD44-positive cells gated as shown were stained for CD62L (CD62Lhigh, CM), right panel. Thin lines: YNCD4; thick lines: ANCD4. Numbers with grey background are for YNCD4; numbers with white background are for ANCD4. (C) Pooled data from multiple experiments as in (B) above showing CM cells as a percentage of CD44high cells from Yg and Ad mice. P = 0.0026 by Mann–Whitney test; n as indicated. Horizontal line depicts mean value. (D) Proportions of annexin V-positive cells in CM populations in experiments as in (B) above. P = 0.006 by Mann–Whitney test; n as indicated. Horizontal line depicts mean value.
Fig. 7.
Fig. 7.
Poor CM in CD4 cells in Ad mice. (A) CD4 cells were gated from stained splenic cell populations of individual mice (data not shown). CD44 gating on CD4 cells is shown (left panel). On gated CD44 cells, CD62L staining and CM gate is shown in the right panel. Thin lines: Yg mice; thick lines: Ad mice. Numbers with grey background are for Yg mice; numbers with white background are for Ad mice. (B) Pooled data as in (A) above from Yg and Ad mice showing CM cells as a proportion of CD44+ cells in splenic CD4 cells. Mean ± SEM, n = 17. (C) A representative plot to show proportions of CM cells from WT and c-Rel-null (left panel) and WT and B6.lpr (right panel) mice in splenic CD4 cells. Gating for CD44 as in (A) above (data not shown). Thin line: WT mice; thick line: c-Rel-null (left) or B6.lpr (right) mice. Numbers with grey background are for WT mice; numbers with white background are for c-Rel-null (left) or B6.lpr (right) mice. (D) IFN-gamma levels in culture supernatants from mOA recall assays in vitro on lymph node cells from Yg and Ad mice immunized with mOA 7, 28 and 45 days prior to assay.

Similar articles

Cited by

References

    1. Linton P, Thoman ML. T cell senescence. Front. Biosci. 2001;6:D248. - PubMed
    1. Miller RA. The aging immune system: primer and prospectus. Science. 1996;273:70. - PubMed
    1. Pawelec G, Solana R, Remarque E, Mariani E. Impact of aging on innate immunity. J. Leukoc. Biol. 1998;64:703. - PubMed
    1. Ginaldi L, De Martinis M, D'Ostilio A, et al. The immune system in the elderly: I. Specific humoral immunity. Immunol. Res. 1999;20:101. - PubMed
    1. Haynes L, Linton PJ, Swain SL. Age-related changes in CD4 T cells of T cell receptor transgenic mice. Mech. Ageing Dev. 1997;93:95. - PubMed

Publication types

MeSH terms