. 2009 Oct;15(10):1219-23.
doi: 10.1038/nm.1971. Epub 2009 Sep 13.

Three-dimensional microscopy of the tumor microenvironment in vivo using optical frequency domain imaging

Affiliations

Three-dimensional microscopy of the tumor microenvironment in vivo using optical frequency domain imaging

Benjamin J Vakoc et al. Nat Med. 2009 Oct.

Abstract

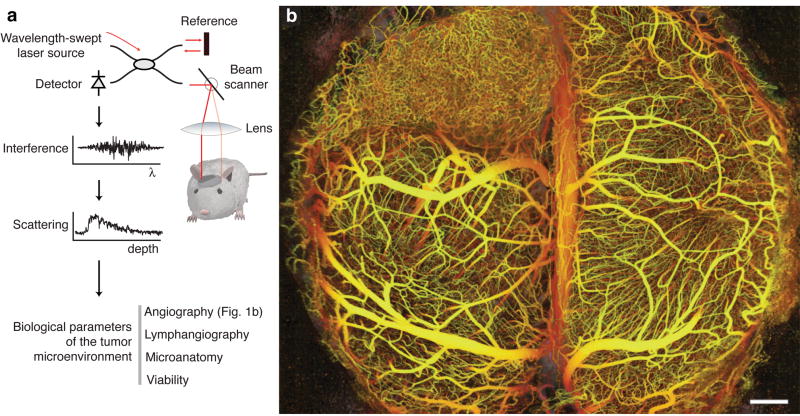
Intravital multiphoton microscopy has provided powerful mechanistic insights into health and disease and has become a common instrument in the modern biological laboratory. The requisite high numerical aperture and exogenous contrast agents that enable multiphoton microscopy, however, limit the ability to investigate substantial tissue volumes or to probe dynamic changes repeatedly over prolonged periods. Here we introduce optical frequency domain imaging (OFDI) as an intravital microscopy that circumvents the technical limitations of multiphoton microscopy and, as a result, provides unprecedented access to previously unexplored, crucial aspects of tissue biology. Using unique OFDI-based approaches and entirely intrinsic mechanisms of contrast, we present rapid and repeated measurements of tumor angiogenesis, lymphangiogenesis, tissue viability and both vascular and cellular responses to therapy, thereby demonstrating the potential of OFDI to facilitate the exploration of physiological and pathological processes and the evaluation of treatment strategies.


Figures

Figure 1
Figure 1
Principles of in vivo multiparametric imaging with optical frequency domain imaging (OFDI). (a) An optical beam is focused into the tissue. The light reflected across all depths is combined with a reference beam and the interference signal is recorded as a function of light wavelength from 1,220 nm to 1,360 nm. The amplitude and phase of the reflected light as a function of wavelength is used to localize the reflected signal as a function of depth. At a given depth, the amplitude and phase of the reflected signal as a function of time is used to derive the optical scattering properties and thereby the tissue structure and function.(b) The depth-projected vasculature within the first 2 mm of mouse brain bearing a xenotransplanted U87 human glioblastoma multiforme tumor imaged with OFDI. Depth is denoted by color: yellow (superficial) to red (deep). Scale bar, 500 μm.
Figure 2
Figure 2
Comparison of multiphoton and OFDI angiography. (a,b) Wide-field imaging of an MCaIV tumor implanted in the dorsal skinfold chamber with OFDI (a) and MPM (b). Imaging with MPM over this field of view required the acquisition and subsequent alignment of 30–40 separate three-dimensional image stacks to sample a field of view equivalent to that of the OFDI instrument. Imaging duration was 10 m for OFDI and 2 h for MPM. Faster MPM imaging times could be obtained using lower magnification lenses at the expense of resolution and depth of penetration. (c,d) Highlighted regions in a and b demonstrate the enhanced ability of OFDI (c) to visualize deeper vessels and distinguish morphology in regions of vascular leakage relative to MPM (d). (e,f) Differences in resolution of the techniques showing the greater detail of finer vascular structures obtainable by MPM (f) in comparison to OFDI (e). (g–i) The application of automated vascular tracing to registered datasets of normal brain vasculature acquired with OFDI (g) and MPM (h) allowed quantification of the resolution of OFDI angiography and validation of the morphological measurements obtained from OFDI (i). Scale bars, 250 μm.
Figure 3
Figure 3
Contrast-free lymphangiography using OFDI. (a) The scattering signal along a single depth scan within an OFDI image of a mouse ear shows the reduced scattering between the upper (2) and lower (3) boundaries of a patent lymphatic vessel. Scattering within the vessel is similar to background levels above the upper surface of the ear (1) or below the lower surface (4). (b,c) In addition to lymphatic vessels revealed by traditional cutaneous injection of Evan’s blue dye (c), OFDI was able to detect numerous additional vessels in the normal dorsal skin (b) and resolve the lymphatic valves found between individual lymphangions (white arrowhead, formula image
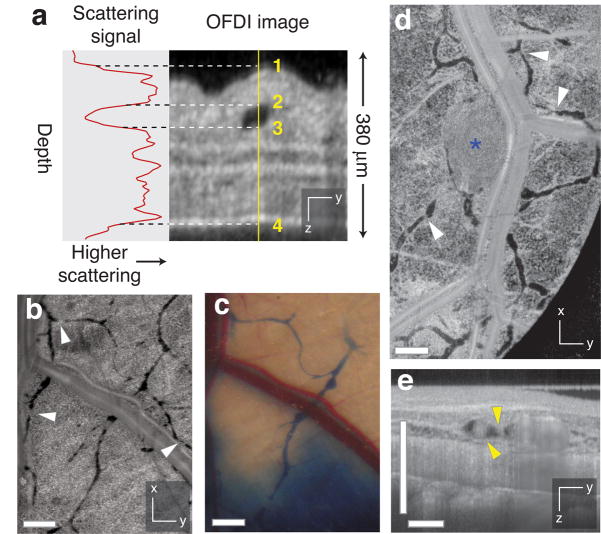
). (d) HSTS26T tumor (blue asterisk, *) associated lymphatics exhibiting hyperplasia. (e) Cross-sectional presentations of a lymphatic vessel showing cellular masses (yellow arrowhead, formula image) located near the tumor in d. Scale bars, 500 μm.
Figure 4
Figure 4
Imaging tissue viability. (a) Comparison of standard hematoxylin and eosin staining (top) with OFDI (middle) reveals association of tissue necrosis with highly scattering regions. Viable and necrotic regions within the same tumor highlighted by color gradients indicating scattering intensity (lower). (b) Scattering properties correlated with the microvasculature during tumor progression illustrate the expansion of necrotic/apoptotic regions in areas with minimal vascular supply. (c) Quantitative analysis of tissue viability and vascular regions in vivo revealed an increase in the fraction of necrotic/apoptotic tissue during tumor progression. Scale bars in a, 500 μm; scale bars in b, 1.0 mm.
Figure 5
Figure 5
Multiparametric response of directed anti-cancer therapy characterized by OFDI. (a) Representative control and treated tumors 5 d after initiation of anti-angiogenic VEGFR-2 blockade exhibit strikingly different vascular morphologies. The lymphatic vascular networks are also presented (blue) for both tumors. (b) Quantification of tumor volume and vascular geometry and morphology in response to VEGF-R2 blockade. Control n = 5, Treated n = 6. (c) Images of tissue scattering immediately prior to and 2d following administration of targeted cytotoxic therapy (diphtheria toxin) or saline to mice bearing human tumor xenografts (LS174T) in dorsal skinfold chambers. Apoptosis induced by diphtheria toxin is manifest as increased tissue scattering relative to control animals. (d) Quantification of the response to diphtheria toxin administration. Control n = 3, Treated n = 3. Scale bars, 500 μm. Statistically significant differences (P < 0.05) at given time points are denoted by asterisks.

References

    1. Masters BR, So PT. Handbook of Biomedical Nonlinear Optical Microscopy. Oxford University Press; New York: 2008.
    1. Brown EB, et al. In vivo measurement of gene expression, angiogenesis and physiological function in tumors using multiphoton laser scanning microscopy. Nat Med. 2001;7:864–868. - PubMed
    1. Jain RK. Normalization of tumor vasculature: An emerging concept in antiangiogenic therapy. Science. 2005:58–62. - PubMed
    1. Huang D, et al. Optical coherence tomography. Science. 1991;254:1178. - PMC - PubMed
    1. Yun SH, Tearney GJ, de Boer JF, Iftimia N, Bouma BE. High-speed optical frequency-domain imaging. Opt Express. 2003;11:2953–2963. - PMC - PubMed

Publication types