

Eradication of chronic myeloid leukemia stem cells: a novel mathematical model predicts no therapeutic benefit of adding G-CSF to imatinib
- PMID: 19749982
- PMCID: PMC2730033
- DOI: 10.1371/journal.pcbi.1000503
Eradication of chronic myeloid leukemia stem cells: a novel mathematical model predicts no therapeutic benefit of adding G-CSF to imatinib
Abstract
Imatinib mesylate induces complete cytogenetic responses in patients with chronic myeloid leukemia (CML), yet many patients have detectable BCR-ABL transcripts in peripheral blood even after prolonged therapy. Bone marrow studies have shown that this residual disease resides within the stem cell compartment. Quiescence of leukemic stem cells has been suggested as a mechanism conferring insensitivity to imatinib, and exposure to the Granulocyte-Colony Stimulating Factor (G-CSF), together with imatinib, has led to a significant reduction in leukemic stem cells in vitro. In this paper, we design a novel mathematical model of stem cell quiescence to investigate the treatment response to imatinib and G-CSF. We find that the addition of G-CSF to an imatinib treatment protocol leads to observable effects only if the majority of leukemic stem cells are quiescent; otherwise it does not modulate the leukemic cell burden. The latter scenario is in agreement with clinical findings in a pilot study administering imatinib continuously or intermittently, with or without G-CSF (GIMI trial). Furthermore, our model predicts that the addition of G-CSF leads to a higher risk of resistance since it increases the production of cycling leukemic stem cells. Although the pilot study did not include enough patients to draw any conclusion with statistical significance, there were more cases of progression in the experimental arms as compared to continuous imatinib. Our results suggest that the additional use of G-CSF may be detrimental to patients in the clinic.
Conflict of interest statement
Consulting for Novartis and Bristol-Myers Squibb (TH); Consulting for Novartis (FM).
Figures

 , during imatinib treatment which initiates on day 0. The leukemic cell burden declines in a multi-phasic manner: terminally differentiated leukemic cells decrease at their death rate,
  per day, until they reach a steady state with differentiated leukemic cells, then they track the latter's disease kinetics (slope not shown for reasons of low resolution of the data). Differentiated leukemic cells decline at their death rate,
  per day, until they reach an equilibrium with leukemic progenitors (green slope). Progenitors decline at their death rate,
  per day, until they reach an equilibrium with leukemic stem cells (blue slope). These slopes are estimated from the IRIS data . Leukemic stem cells increase or decline at a rate equal to the asymptotic value of
  . In this figure, we show examples of the kinetics in which leukemic stem cells are assumed to decrease during imatinib therapy (red slope), and in which leukemic stem cells continue to increase during therapy (dashed line). Parameter values are
  ,
,  ,
,  ,
,  ,
,  ,
,  ,
,  ,
,  ,
,  ,
,  ,
,  ,
,  ,
,  ,
,  , and
, and  . The other parameters are calculated such that in equilibrium, there are
  normal terminally differentiated cells,
  normal differentiated cells,
  normal progenitors, and
  normal and
  leukemic stem cells (cycling plus quiescent). All parameters whose values during therapy are not specified are unaltered by treatment. Our parameter choices set the initial equilibrium frequency of both normal and leukemic cycling stem cells to 90% (
 ).
).
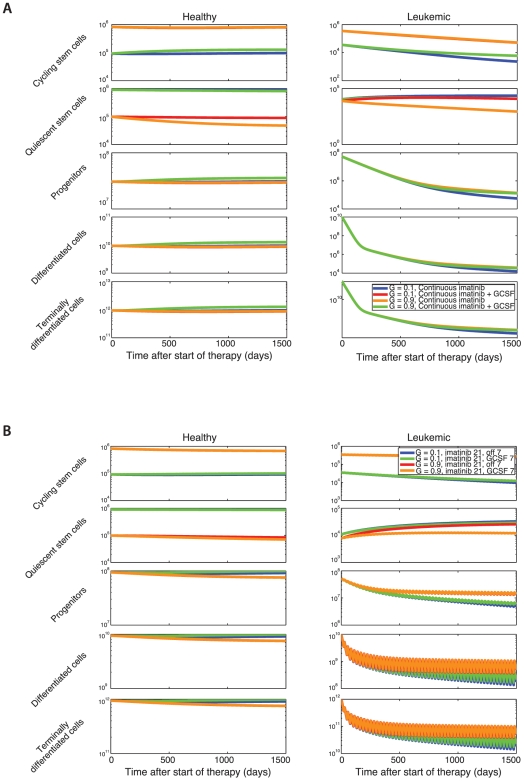
 . Initially, the healthy cells are in equilibrium and there is one leukemic stem cell. As the leukemic cell population increases, the healthy cell population begins to decrease due to competition. Treatment is initiated once the leukemic cell burden has reached a threshold of
  cells, at which point the leukemic cell burden begins to decline. Three scenarios are investigated: (i) the fraction of cycling stem cells is 10%,
  , using values of
  (blue lines), (ii) the fraction of cycling stem cells is 50%,
  , with
  (red lines), and (iii) the fraction of cycling stem cells is 90%,
  , with
  (green lines). Here
  and
and  , with all other parameters as in Fig. 1. (B) We show the sensitivity of the model to
  and
and  (i)
(i)  (blue lines), (ii)
  (red lines), and (iii)
  (green lines); in all cases
  is chosen such that
  . Note the relative insensitivity of number of terminally differentiated leukemic cells to
  and
and  .
.
 and
and  ; all other parameters are as in Fig. 2. (B) The dynamics of the hematopoietic system during therapy with pulsed imatinib (3 weeks on, one week off; blue and red lines) or imatinib alternating with G-CSF (3 weeks imatinib, one week G-CSF; green and orange lines) are shown. We investigate the system for two different equilibrium frequencies of cycling stem cells: G = 0.1 (blue and green lines), and G = 0.9 (red and orange lines). Again, the addition of G-CSF has an effect only if G = 0.1. Parameter values during G-CSF therapy are as above.
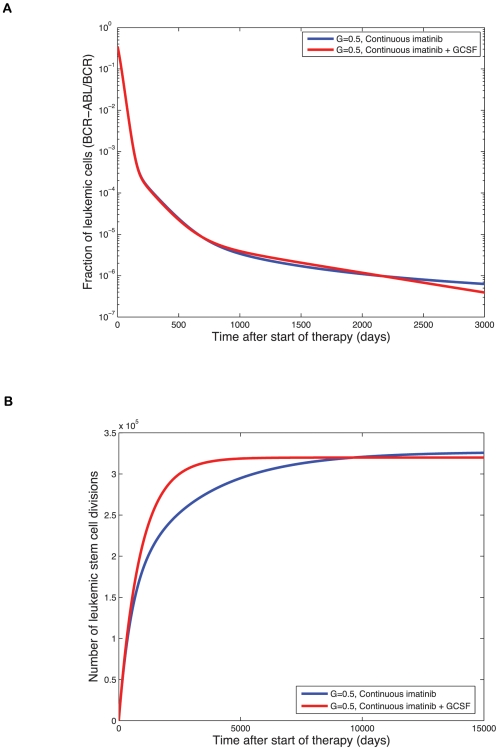
 since normal cells have two alleles of BCR while leukemic cells have only one. Treatment starts on day zero and leads to a tri-phasic depletion of the leukemic cell burden if imatinib is capable of depleting leukemic stem cells. Although the addition of G-CSF initially increases the number of terminally differentiated leukemic cells, the long-term trend reveals that adding G-CSF does result in a faster rate of depletion of the leukemic cell burden and eventually leads to smaller numbers of terminally differentiated leukemic cells. The initial equilibrium frequency of cycling stem cells is
  with
with  and
and  (all other parameters are as in Fig. 4). (B) We show the long-term simulation results for the number of leukemic stem cell divisions during continuous imatinib therapy with (red line) and without (blue line) G-CSF. This number is directly proportional to the risk of resistance to therapy. Until the crossover point of about 10,000 days, imatinib therapy leads to a lower number of stem cell divisions and therefore to a lower probability of resistance. After the crossover point, combination therapy with imatinib and G-CSF leads to a lower risk of resistance. All parameter values are as above.
References
-
- Bruce WR, Van Der Gaag H. A Quantitative Assay for the Number of Murine Lymphoma Cells Capable of Proliferation in Vivo. Nature. 1963;199:79–80. - PubMed
-
- Lapidot T, Sirard C, Vormoor J, Murdoch B, Hoang T, et al. A cell initiating human acute myeloid leukaemia after transplantation into SCID mice. Nature. 1994;367:645–648. - PubMed
-
- Cobaleda C, Gutierrez-Cianca N, Perez-Losada J, Flores T, Garcia-Sanz R, et al. A primitive hematopoietic cell is the target for the leukemic transformation in human Philadelphia-positive acute lymphoblastic leukemia. Blood. 2000;95:1007–1013. - PubMed
-
- Reya T, Morrison SJ, Clarke MF, Weissman IL. Stem cells, cancer, and cancer stem cells. Nature. 2001;414:105–111. - PubMed
-
- Hope KJ, Jin L, Dick JE. Acute myeloid leukemia originates from a hierarchy of leukemic stem cell classes that differ in self-renewal capacity. Nat Immunol. 2004;5:738–743. - PubMed
Publication types
MeSH terms
Substances
LinkOut - more resources
Full Text Sources
Medical
Miscellaneous
