. 2009 Sep;5(9):e1000504.
doi: 10.1371/journal.pcbi.1000504. Epub 2009 Sep 11.

Evaluation of objective uncertainty in the visual system

Affiliations

Evaluation of objective uncertainty in the visual system

Simon Barthelmé et al. PLoS Comput Biol. 2009 Sep.

Abstract

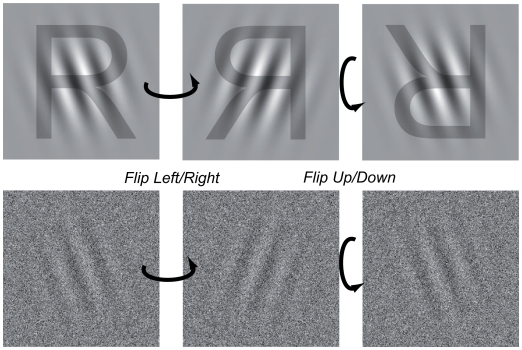
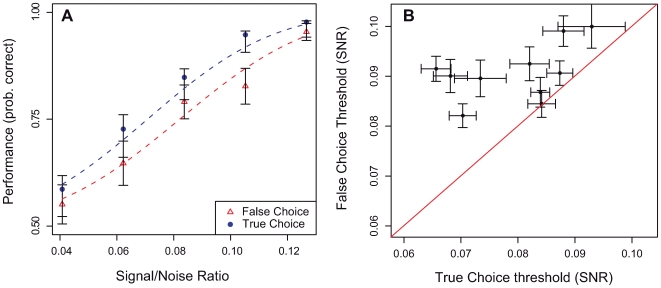
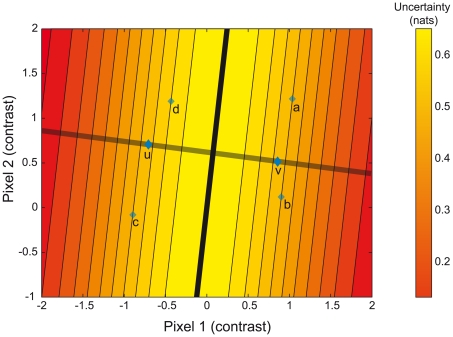
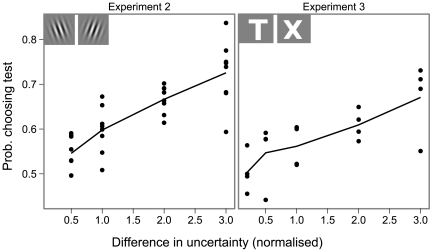
The role of sensory systems is to provide an organism with information about its environment. Because sensory information is noisy and insufficient to uniquely determine the environment, natural perceptual systems have to cope with systematic uncertainty. The extent of that uncertainty is often crucial to the organism: for instance, in judging the potential threat in a stimulus. Inducing uncertainty by using visual noise, we had human observers perform a task where they could improve their performance by choosing the less uncertain among pairs of visual stimuli. Results show that observers had access to a reliable measure of visual uncertainty in their decision-making, showing that subjective uncertainty in this case is connected to objective uncertainty. Based on a Bayesian model of the task, we discuss plausible computational schemes for that ability.


Conflict of interest statement

The authors have declared that no competing interests exist.

Figures

Figure 1
Figure 1. Layout of the experiment.
The two templates appeared on the left- and right-hand sides of the screen. Two test stimuli were displayed simultaneously: they were computed from one of the two templates, to which noise was added. The two test stimuli had equal contrast, as illustrated here. Observers selected first which stimuli they felt more confident making an orientation judgment for (task 1). They were then asked to make that judgment (task 2).
Figure 2
Figure 2. False Choice stimuli.
The left-tilted can be flipped left-to-right to yield the right-tilted template. Another flip, this time up-down, yields back the left-tilted template. In the False Choice condition, we generated one of the stimuli at random, and used a left/right flip or a left/right flip followed by an up/down flip to produce a stimulus with equal uncertainty but different visual aspect. We superpose the shape of a R on the images to illustrate the transformations.
Figure 3
Figure 3. Results - performance.
(a). Results for one observer. Each point represents measured discrimination performance (probability correct) for a given signal-to-noise ratio and condition. Two psychometric functions, one per condition, are fitted to measure performance. The psychometric functions are distinct, indicating that performance was higher in the TC condition. (b). Aggregated results. 75% thresholds are estimated from performance data separately for the two conditions. A higher threshold is indicative of lower performance. Error bars are standard errors obtained from a parametric bootstrap .
Figure 4
Figure 4. The orientation discrimination problem in stimulus space.
The templates u and v are points in a space with dimensions corresponding to pixel luminances. Here we depict the problem for two pixels only. The optimal decision boundary – a plane - is represented by the blue line. Stimuli are obtained by starting from one of the two templates and adding a noise vector. They correspond to points in the space lying around u and v. The response is determined by which side of the plane they fall on. The closer they are from the decision boundary, the higher the chance that they could have been generated equally well from either template, and therefore the higher the uncertainty. Here, A,B and C are all points of equal uncertainty, whereas D has higher uncertainty. The uncertainty is given by the entropy of the posterior distribution, see Methods.
Figure 5
Figure 5. Results of experiment 2 and 3.
In these two experiments, the test and the standard stimuli varied in uncertainty. We plot the proportion of times the test stimulus was chosen as a function of the difference between the uncertainty of the standard and the uncertainty of the test. The dots represent individual results, the solid line is the average over observers. Experiment 2 used orientation discrimination, experiment 3 used letter discrimination. The templates are shown on top of each graph. The levels of uncertainty are standardised across observers, see Text S1.
Figure 6
Figure 6. Proportion of correct predictions for three models of choice.
The maximum of response and absolute difference models are presented in the text. Observers presented a bias in their choice of stimuli (most of them choosing the top one with a proportion higher than chance), so we plot the proportion correct of a model that predicts observers always choosing the stimulus to which they are biased (Bias only, see Methods).

Similar articles

Cited by

References

    1. Tversky A, Kahneman D. Judgment under uncertainty: Heuristics and biases. Science. 1974;185:1124–1131. - PubMed
    1. Gigerenzer GSR. Bounded rationality : the adaptive toolbox. Boston, MA: MIT Press; 2001.
    1. Kahneman D, Tversky A. Prospect Theory. An analysis of decision under risk. Econometrica. 1979;47:263–292.
    1. Schall JD. Neural basis of deciding, choosing and acting. Nature Reviews Neuroscience. 2001;2:33–42. - PubMed
    1. Kepecs A, Uchida N, Zariwala H, Mainen Z. Neural correlates, computation and behavioural impact of decision confidence. Nature 2008 - PubMed

Publication types