Distinct gene number-genome size relationships for eukaryotes and non-eukaryotes: gene content estimation for dinoflagellate genomes
- PMID: 19750009
- PMCID: PMC2737104
- DOI: 10.1371/journal.pone.0006978
Distinct gene number-genome size relationships for eukaryotes and non-eukaryotes: gene content estimation for dinoflagellate genomes
Abstract
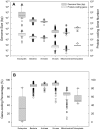
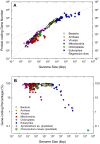
The ability to predict gene content is highly desirable for characterization of not-yet sequenced genomes like those of dinoflagellates. Using data from completely sequenced and annotated genomes from phylogenetically diverse lineages, we investigated the relationship between gene content and genome size using regression analyses. Distinct relationships between log(10)-transformed protein-coding gene number (Y') versus log(10)-transformed genome size (X', genome size in kbp) were found for eukaryotes and non-eukaryotes. Eukaryotes best fit a logarithmic model, Y' = ln(-46.200+22.678X', whereas non-eukaryotes a linear model, Y' = 0.045+0.977X', both with high significance (p<0.001, R(2)>0.91). Total gene number shows similar trends in both groups to their respective protein coding regressions. The distinct correlations reflect lower and decreasing gene-coding percentages as genome size increases in eukaryotes (82%-1%) compared to higher and relatively stable percentages in prokaryotes and viruses (97%-47%). The eukaryotic regression models project that the smallest dinoflagellate genome (3x10(6) kbp) contains 38,188 protein-coding (40,086 total) genes and the largest (245x10(6) kbp) 87,688 protein-coding (92,013 total) genes, corresponding to 1.8% and 0.05% gene-coding percentages. These estimates do not likely represent extraordinarily high functional diversity of the encoded proteome but rather highly redundant genomes as evidenced by high gene copy numbers documented for various dinoflagellate species.
Conflict of interest statement
Figures


References
-
- Lynch M, Conery JS. The origins of genome complexity. Science. 2003;302:1401–1404. - PubMed
-
- Gregory TR. Synergy between sequence and size in large-scale genomics. Nature Rev Genet. 2005;6:699–708. - PubMed
-
- Hackett JD, Anderson DM, Erdner DL, Bhattacharya D. Dinoflagellates: a remarkable evolutionary experiment. Am J Bot. 2004;91:1523–1534. - PubMed
-
- Lin S. The smallest dinoflagellate genome is yet to be found: a comment on LaJeunesse, et al. “Symbiodinium (Pyrrhophyta) genome sizes (DNA content) are smallest among dinoflagellates”. J Phycol. 2006;42:746–748.
Publication types
MeSH terms
Substances
LinkOut - more resources
Full Text Sources
Other Literature Sources

