. 2009 Aug;2(4):279-85.
doi: 10.1111/j.1752-8062.2009.00128.x.

Single cell analysis of complex thymus stromal cell populations: rapid thymic epithelia preparation characterizes radiation injury

Affiliations

Single cell analysis of complex thymus stromal cell populations: rapid thymic epithelia preparation characterizes radiation injury

Kirsten M Williams et al. Clin Transl Sci. 2009 Aug.

Abstract

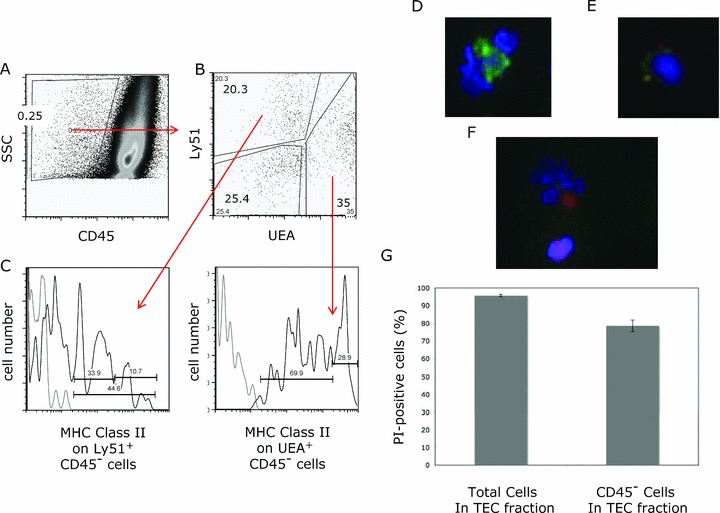
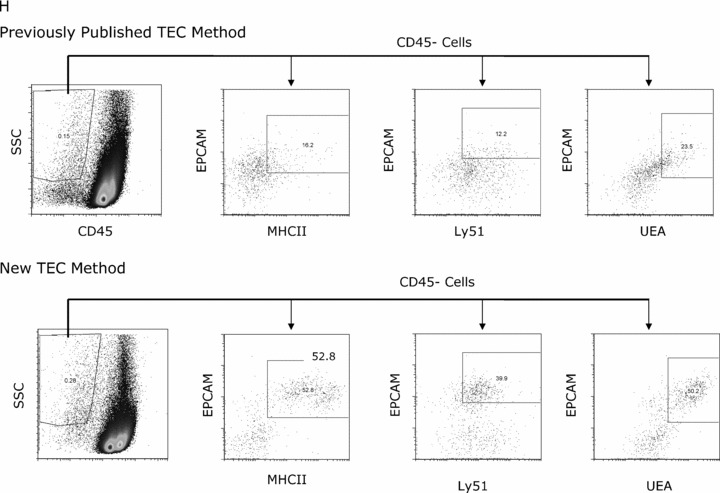
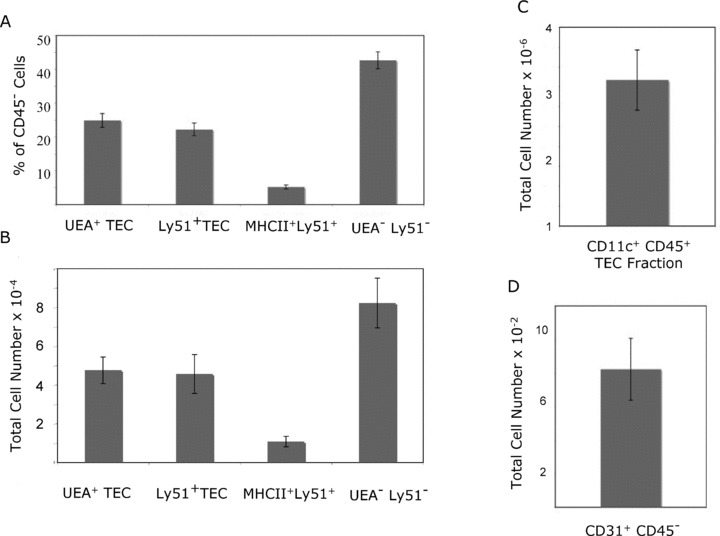
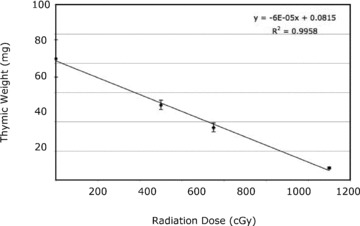
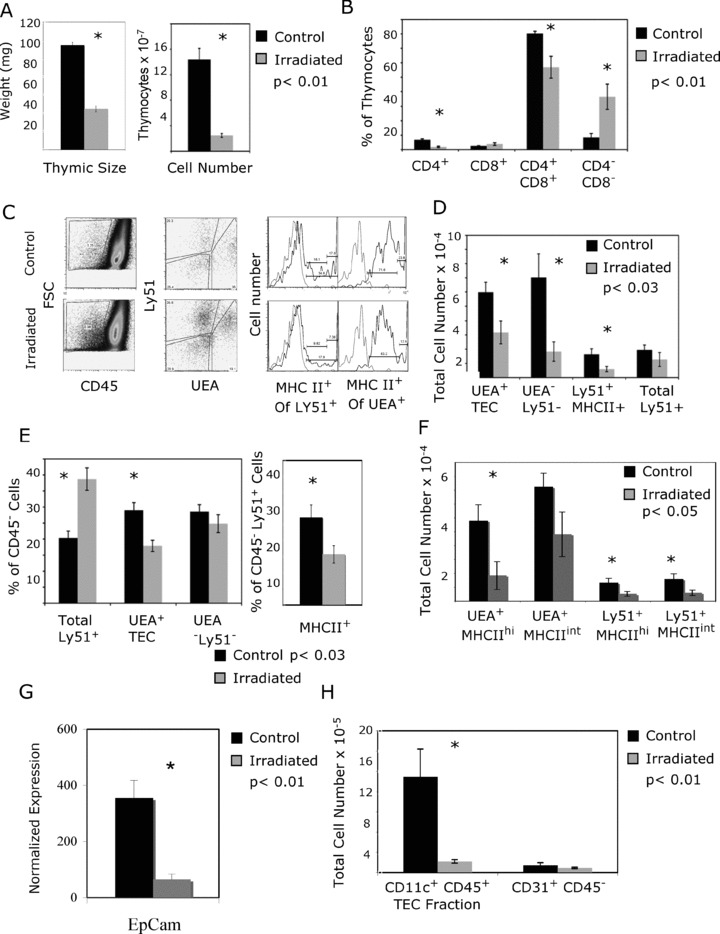
Thymic epithelial cells (TECs) and dendritic cells are essential for the maintenance of thymopoiesis. Because these stromal elements define the progenitor niche, provide critical survival signals and growth factors, and direct positive and negative selection, detailed study of these populations is necessary to understand important elements for thymic renewal after cytotoxic injury. Study of TEC is currently hindered by lengthy enzymatic separation techniques with decreased viability. We present a new rapid separation technique that yields consistent viable TEC numbers in a quarter of the prior preparation time. Using this new procedure, we identify changes in stroma populations following total body irradiation (TBI). By flow cytometry, we show that TBI significantly depletes UEA+ medullary TEC, while sparing Ly51+ CD45- cells. Further characterization of the Ly51+ subset reveals enrichment of fibroblasts (CD45- Ly51+ MHCII-), while cortical TECs (CD45- Ly51+ MHCII+) were markedly reduced. Dendritic cells (CD11lc+ CD45+) were also decreased following TBI. These data suggest that cytotoxic preparative regimens may impair thymic renewal by reducing critical populations of cortical and medullary TEC, and that such thymic damage can be assessed by this new rapid separation technique, thereby providing a means of assessing optimal conditioning pretransplantfor enhancing thymic-dependent immune reconstitution posttranspiant.

Keywords: radiation; separation; thymic epithelial cell.


Figures

Figure 1
Figure 1
TEC subset identification by flow cytometry and immunohistochemistry. TEC populations were enumerated by flow cytometry, with medullary TEC defined as CD45− UEA+, cortical TEC as CD45− Ly51+ MHC class II+ and a triple‐negative population of CD45− UEA‐ Ly51‐. Representative flow cytometry plots are shown for (A) gating of CD45 negative population and (B) discrimination of medullary UEA+ TEC and Ly51+ populations (cortical TEC and fibroblasts) within the CD45− population, and finally (C) MHC class II staining on CD45− Ly51+ to discriminate cortical TEC from fibroblasts and CD45− UEA+ cells (MHC class II high‐proliferating population from the MHC class II intermediate population). For the MHC class II flow cytometry plot, the isotype control is light gray; MHC class II‐specific staining is black. TEC populations were directly visualized using immunohistochemical analysis of TEC preparation samples with or without CD45 column depletion. Hoechst DNA dye was utilized to identify live cells. Representative images demonstrate easily discernable single cell suspension of medullary TEC absent CD45 (red) with large nuclei (blue) UEA+ (green FITC) (D), likely cortical TEC absent CD45 (red) with Ly51+ (PE yellow) and large nuclei (blue) (E), and a thymocyte expressing CD45 (red) with small nuclei (blue) in the lower aspect of the picture with likely dendritic cell (CD45 red positive with large nuclei) in the upper portion of the picture (F). By flow cytometry, viability of the total cell population and the CD45 negative fraction within the TEC fraction using propidium iodide to discriminate dead cells is shown (graph represents four separate TEC preparations of age‐matched mice) (G). Representative flow cytometry plots are shown for comparison of the previously published TEC preparation method and the new method (H). The dot plot to the left demonstrates side scatter versus CD45; subsequent plots reveal populations within the CD45 negative fraction, showing MHC class II versus EpCAM and EpCAM+ Ly51+ (cortical) or UEA+ (medullary) TEC.
Figure 1
Figure 1
TEC subset identification by flow cytometry and immunohistochemistry. TEC populations were enumerated by flow cytometry, with medullary TEC defined as CD45− UEA+, cortical TEC as CD45− Ly51+ MHC class II+ and a triple‐negative population of CD45− UEA‐ Ly51‐. Representative flow cytometry plots are shown for (A) gating of CD45 negative population and (B) discrimination of medullary UEA+ TEC and Ly51+ populations (cortical TEC and fibroblasts) within the CD45− population, and finally (C) MHC class II staining on CD45− Ly51+ to discriminate cortical TEC from fibroblasts and CD45− UEA+ cells (MHC class II high‐proliferating population from the MHC class II intermediate population). For the MHC class II flow cytometry plot, the isotype control is light gray; MHC class II‐specific staining is black. TEC populations were directly visualized using immunohistochemical analysis of TEC preparation samples with or without CD45 column depletion. Hoechst DNA dye was utilized to identify live cells. Representative images demonstrate easily discernable single cell suspension of medullary TEC absent CD45 (red) with large nuclei (blue) UEA+ (green FITC) (D), likely cortical TEC absent CD45 (red) with Ly51+ (PE yellow) and large nuclei (blue) (E), and a thymocyte expressing CD45 (red) with small nuclei (blue) in the lower aspect of the picture with likely dendritic cell (CD45 red positive with large nuclei) in the upper portion of the picture (F). By flow cytometry, viability of the total cell population and the CD45 negative fraction within the TEC fraction using propidium iodide to discriminate dead cells is shown (graph represents four separate TEC preparations of age‐matched mice) (G). Representative flow cytometry plots are shown for comparison of the previously published TEC preparation method and the new method (H). The dot plot to the left demonstrates side scatter versus CD45; subsequent plots reveal populations within the CD45 negative fraction, showing MHC class II versus EpCAM and EpCAM+ Ly51+ (cortical) or UEA+ (medullary) TEC.
Figure 2
Figure 2
The new method for TEC isolation is reproducible and consistent. Six groups of three age‐matched thymi (18 total) were subjected to the new method for TEC isolation using greater than two technicians over multiple days. TEC, dendritic cells, endothelial cells, fibroblasts, and thymocytes were enumerated by flow cytometry after separation using the new method. The proportions of each population within the CD45 negative fraction (A) and total numbers (B) were consistent across experiments and technicians. The dendritic cell (C) and endothelial cell (D) numbers were also reliable across experiments and examiners (standard error bars shown for each population).
Figure 3
Figure 3
Irradiation linearly decreases thymic size. Six groups of thymi (five per group) received a single dose of radiation and were sacrificed 1 week later without stem cell rescue. The thymic weights were decreased with escalating radiation dose in a linear fashion (standard error bars shown).
Figure 4
Figure 4
Irradiation selectively decreases cortical and medullary TEC and dendritic cells while sparing fibroblasts and endothelial cells. Six groups of three mice each (18 total) were sacrificed 1 week after receiving 750‐cGy irradiation. Using the new isolation method, the separated products (TEC‐enriched and thymocytes) were analyzed using flow cytometry. Data represent six experiments with standard error bars. (A) Thymic weight and thymocyte number were significantly decreased after irradiation (p < 0.01). (B) The proportion of single‐positive CD4+ and CD4+ CD8+ double‐positive thymocytes were significantly decreased following radiation, while the double‐negative cells were enriched (p < 0.01). The proportion of TEC increases following irradiation (C); however, the total number of TEC is decreased (D). Representative dot plots demonstrate a smaller percentage of TEC in the control mice with greater proportion of UEA+ TEC and MHC class II staining on the Ly51 positive cells (C). In contrast, the proportion of Ly51+ MHC class II negative cells is greater in the irradiated cohort. This is demonstrated graphically (E). Because published data have suggested that MHC class II high UEA+ cells proliferate to the greatest extent, 46 TECs were individually analyzed with regard to MHC class II expression to identify changes in these subpopulations (F). The greatest cell loss was in the UEA+ MHCII high population (3‐fold depletion), although cortical TEC populations were also significantly decreased. For the MHC class II flow cytometry plot, the isotype control is light gray; MHC class II‐specific staining is black. Loss of TEC number following irradiation was confirmed by RT‐PCR of EpCAM gene expression in digested samples (G). EpCAM was normalized to GAPDH; total CD45 negative numbers were then used to normalize to stromal fractions. Finally, the dendritic cell number is significantly decreased following irradiation, while the endothelial cell number is unaffected (H).

References

    1. Hakim FT, Memon SA, Cepeda R, Jones EC, Chow CK, Kasten‐Sportes C, Odom J, Vance BA, Christensen BL, Mackall CL, Gress RE. Age‐dependent incidence, time course, and consequences of thymic renewal in adults. J Clin Invest. 2005; 115(4): 930–939. - PMC - PubMed
    1. Lewin SR, Heller G, Zhang L, Rodrigues E, Skulsky E, Van Den Brink MR, Small TN, Kernan NA, O’Reilly RJ, Ho DD, Young JW. Direct evidence for new T‐cell generation by patients after either T‐cell‐depleted or unmodified allogeneic hematopoietic stem cell transplantations. Blood. 2002; 100(6): 2235–2242. - PubMed
    1. Williams KM, Hakim FT, Gress RE. T cell immune reconstitution following lymphodepletion. Semin Immunol. 2007; 19(5): 318–330. - PMC - PubMed
    1. Parkman R, Cohen G, Carter SL, Weinberg KI, Masinsin B, Guinan E, Kurtzberg J, Wagner JE, Kernan NA. Successful immune reconstitution decreases leukemic relapse and improves survival in recipients of unrelated cord blood transplantation. Biol Blood Marrow Transplant. 2006; 12(9): 919–927. - PubMed
    1. King C, Ilic A, Koelsch K, Sarvetnick N. Homeostatic expansion of T cells during immune insufficiency generates autoimmunity. Cell. 2004; 117(2): 265–277. - PubMed

Publication types

Substances