. 2009 Sep 11;4(9):e6979.
doi: 10.1371/journal.pone.0006979.

Adult type 3 adenylyl cyclase-deficient mice are obese

Affiliations

Adult type 3 adenylyl cyclase-deficient mice are obese

Zhenshan Wang et al. PLoS One. .

Abstract

Background: A recent study of obesity in Swedish men found that polymorphisms in the type 3 adenylyl cyclase (AC3) are associated with obesity, suggesting the interesting possibility that AC3 may play a role in weight control. Therefore, we examined the weight of AC3 mice over an extended period of time.

Methodology/principal findings: We discovered that AC3(-/-) mice become obese as they age. Adult male AC3(-/-) mice are about 40% heavier than wild type male mice while female AC3(-/-) are 70% heavier. The additional weight of AC3(-/-) mice is due to increased fat mass and larger adipocytes. Before the onset of obesity, young AC3(-/-) mice exhibit reduced physical activity, increased food consumption, and leptin insensitivity. Surprisingly, the obesity of AC3(-/-) mice is not due to a loss of AC3 from white adipose and a decrease in lipolysis.

Conclusions/significance: We conclude that mice lacking AC3 exhibit obesity that is apparently caused by low locomotor activity, hyperphagia, and leptin insensitivity. The presence of AC3 in primary cilia of neurons of the hypothalamus suggests that cAMP signals generated by AC3 in the hypothalamus may play a critical role in regulation of body weight.


Conflict of interest statement

Competing Interests: The authors have declared that no competing interests exist.

Figures

Figure 1
Figure 1. AC3−/− mice exhibit adult onset obesity.
(A) Representative eight-month-old AC3+/+ and AC3−/− male mice. (B) The growth curve of AC3−/− male mice compared to AC3+/+ male mice. (C) The growth curve of AC3−/− female mice compared to AC3+/+ female mice. At each time point, the data are the average of 16 mice. Data are represented as means±SEM. *, p<0.05; **, p<0.01.
Figure 2
Figure 2. AC3−/− mice weight gain is due to an increase in fat mass.
The body compositions of AC3+/+ and AC3−/− mice were determined in conscious mice by quantitative magnetic resonance (QMR). (A) Body composition of male AC3+/+ and AC3−/− mice at 10 months. (B) Body composition of female AC3+/+ and AC3−/− mice at 10 months. (C) Percentage of fat mass and lean mass of male AC3+/+ and AC3−/− mice at 10 months. (D) Percentage of fat mass and lean mass of female AC3+/+ and AC3−/− mice at 10 months. N = 8 mice for each group. Data are represented as means±SEM. **, p<0.01.
Figure 3
Figure 3. AC3−/− mice have larger adipocytes.
Representative hematoxylin sections of epididymal adipose tissue from (A) AC3+/+ and (B) AC3−/− mice. Scale bar, 50 µm. (C) The distribution of adipocyte cell diameter of AC3+/+ and AC3−/− mice. (D) The average adipocyte cell diameter of AC3+/+ and AC3−/− mice. (E) The adipocyte cell volume of AC3+/+ and AC3−/− mice. Data is the average from four AC3−/− and four AC3+/+ mice at 8 months. A total of 400 cells from each genotype were counted. Data are represented as means±SEM. **, p<0.01.
Figure 4
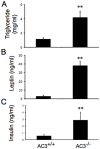
Figure 4. Serum leptin, insulin, and triglyceride are increased in AC3−/− mice.
(A) Serum triglyceride was measured in AC3+/+ and AC3−/− mice at age of 8 months. (B) Serum leptin was measured in AC3+/+ and AC3−/− mice at an age of 8 months. (C) Serum insulin was measured in AC3+/+ and AC3−/− at 8 months. There were significant differences in triglyceride, leptin, and insulin levels between AC3+/+ and AC3−/− mice. Each genotype of group mice consisted of 8 animals. Data are represented as means±SEM. **, p<0.01.
Figure 5
Figure 5. Adult AC3−/− mice exhibit decreased locomotor activity.
(A) Locomotor activity of male AC3+/+ and AC3−/− mice. (B) Locomotor activity of female AC3+/+ and AC3−/− mice. N = 8 animals for each group at an age of 10 months. (C) Food consumption of male AC3+/+ and AC3−/− mice. N = 5 animals for each group at an age of 2 months. Data are represented as means±SEM. **, p<0.01.
Figure 6
Figure 6. Young AC3−/− mice demonstrate decreased locomotor activity.
(A,B,C,D) Representative locomotor activity of two mice for 6 days: AC3+/+ male mice (A), AC3−/− male mice (B), AC3+/+ female mice (C), and AC3−/− female mice (D). (E) Average activity of AC3+/+ and AC3−/− mice in the light phase. (F) Average activities of AC3+/+ and AC3−/− mice in the dark phase. For (E,F), N = 12 mice at an age of 2 months. There is a significant difference in locomotor activity between AC3+/+ and AC3−/− mice in the light and dark phases. **, p<0.01.
Figure 7
Figure 7. Young AC3−/− mice have elevated serum leptin levels and low leptin sensitivity.
(A) The body weight of young AC3+/+ and AC3−/− male mice. N = 5 for each group of animals. There is no significant difference between AC3+/+ and AC3−/− mice. (B) The body weight of young AC3+/+ and AC3−/− female mice. For AC3+/+ female mice, N = 9; for AC3−/− female mice, N = 11. There is no significant difference between AC3+/+ and AC3−/− mice. (C) The serum leptin levels of young AC3+/+ and AC3−/− male mice. N = 5 for each group. There is significant difference between AC3+/+ and AC3−/− mice (p<0.01). (D) The serum leptin levels of young AC3+/+ and AC3−/− female mice. For AC+/+ female mice, N = 9; for AC3−/− female mice, n = 11. There is a significant difference between AC3+/+ and AC3−/− mice (p<0.01). (E) The leptin effects of body weight in AC+/+ and AC3−/− mice. N = 11 for each group of animals. There is a significant difference between AC3+/+ and AC3−/− mice (p<0.01). (F) The leptin effects of food intake in AC+/+ and AC3−/− mice. Each genotype of mice consists of 11 animals. There is a significant difference between AC3+/+ and AC3−/− mice. **, p<0.01.
Figure 8
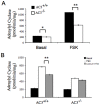
Figure 8. The adenylyl cyclase activity of the hypothalamus is reduced in AC3−/− mice.
(A) Forskolin stimulated adenylyl cyclase activity in the hypothalamus is absent in AC3−/− mice. (B) Calcium inhibition of forskolin-stimulated adenylyl cyclase in the hypothalamus is impaired in AC3−/− mice. The adenylyl cyclase activity was assayed from homogenized hypothalamus. The forskolin concentration was 50 µM. The free calcium concentration was 19.9 µM. Data are represented as means±SEM. *, p<0.05; **, p<0.01. N = 3 for each genotype.
Figure 9
Figure 9. AC3 is expressed in the cilia of VMH neurons.
(A,B,C,D) Representative images of AC3 immunoreactive cilia in the VMH regions of the hypothalamus in AC3+/+ mice labeled with antibodies AC3 (green) (A), Sstr3 (red) (B) and colocalization of AC3 and Sstr3 (merge). Scale bar, 20 µm. (E,F,G,H) Representative images of immunoreactive cilia in the VMH regions of the hypothalamus in AC3−/− mice labeled with antibodies AC3 (green) (E), Sstr3 (red) (F) and colocalization of AC3 and Sstr3 (merge). Scale bar, 20 µm. (D,H) Enlarged images of selected areas in of AC3+/+ (D) and AC3−/− (H). Scale bar, 5 µm. Nuclei are stained with Hoestch (blue). N = 3 for each genotype.

References

    1. Kopelman PG. Obesity as a medical problem. Nature. 2000;404:635–643. - PubMed
    1. Bray GA. Obesity: The disease. J Med Chem. 2006;49:4001–4007. - PubMed
    1. Fontaine KR, Redden DT, Wang C, Westfall AO, Allison DB. Years of life lost due to obesity. JAMA. 2003;289:187–193. - PubMed
    1. Spiegelman BM, Flier JS. Obesity and the regulation of energy balance. Cell. 2001;104:531–543. - PubMed
    1. Fontaine KR, Barofsky I. Obesity and health-related quality of life. Obes Rev. 2001;2:173–182. - PubMed

Publication types