. 2010 Mar;25(3):554-63.
doi: 10.1359/jbmr.090827.

Hyponatremia-induced osteoporosis

Affiliations

Hyponatremia-induced osteoporosis

Joseph G Verbalis et al. J Bone Miner Res. 2010 Mar.

Abstract

There is a high prevalence of chronic hyponatremia in the elderly, frequently owing to the syndrome of inappropriate antidiuretic hormone secretion (SIADH). Recent reports have shown that even mild hyponatremia is associated with impaired gait stability and increased falls. An increased risk of falls among elderly hyponatremic patients represents a risk factor for fractures, which would be further amplified if hyponatremia also contributed metabolically to bone loss. To evaluate this possibility, we studied a rat model of SIADH and analyzed data from the Third National Health and Nutrition Examination Survey (NHANES III). In rats, dual-energy X-ray absorptiometry (DXA) analysis of excised femurs established that hyponatremia for 3 months significantly reduced bone mineral density by approximately 30% compared with normonatremic control rats. Moreover, micro-computed tomography (microCT) and histomorphometric analyses indicated that hyponatremia markedly reduced both trabecular and cortical bone via increased bone resorption and decreased bone formation. Analysis of data from adults in NHANES III by linear regression models showed that mild hyponatremia is associated with increased odds of osteoporosis (T-score -2.5 or less) at the hip [odds ratio (OR) = 2.85; 95% confidence interval (CI) 1.03-7.86; p < .01]; all models were adjusted for age, sex, race, body mass index (BMI), physical activity, history of diuretic use, history of smoking, and serum 25-hydroxyvitamin D [25(OH)D] levels. Our results represent the first demonstration that chronic hyponatremia causes a substantial reduction of bone mass. Cross-sectional human data showing that hyponatremia is associated with significantly increased odds of osteoporosis are consistent with the experimental data in rodents. Our combined results suggest that bone quality should be assessed in all patients with chronic hyponatremia.


Figures

Fig. 1
Fig. 1
BMD is decreased in chronically hyponatremic rats. (A) BMD in excised femora from normonatremic control rats (treated with DDAVP and maintained on a solid diet) and hyponatremic rats (treated with DDAVP and maintained on a liquid diet). (B) BMD in excised femora from normonatremic control rats on liquid diet alone, on solid diet and receiving vitamin D (VD), and from hyponatremic rats with and without VD treatment. Data are shown as mean ± SEM. *p < .001.
Fig. 2
Fig. 2
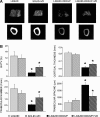
Bone µCT analysis of chronically hyponatremic rats. (A) Representative images from 3D µCT reconstruction of femora from normonatremic control rats without (liquid diet group, rat 7; [Na+] = 140 mmol/L) and with vitamin D (VD) treatment (solid diet group, rat 1; [Na+] = 135 mmol/L) and from hyponatremic rats without VD treatment (liquid diet + DDAVP group, rat 14; [Na+] = 114 mmol/L) and with VD treatment (liquid diet + DDAVP + VD group, rat 21; [Na+] = 122 mmol/L). (B) Bone volume/total volume, cortical thickness, trabecular number, and trabecular spacing assessed at the same site by µCT. Data are shown as mean ± SEM; *p < .01 compared with normonatremic rats.
Fig. 3
Fig. 3
Histologic analyses by von Kossa staining of 5 µm thick longitudinal sections from the undecalcified distal femora (metaphysis and epiphysis) from experiment 1. Representative images show thinning of trabecular bone (arrows) and cortical bone (arrowheads) in sections from hyponatremic rats compared with sections from normonatremic control. Bar = 1 mm.
Fig. 4
Fig. 4
(A) Histomorphometric analysis of tibia from experiment 1 reveals increase in osteoclast numbers (TRAP-positive multinucleated cells) per tissue area in chronically hyponatremic rats. Data are shown as mean ± SEM; *p < .01 comparing samples from normonatremic and hyponatremic rats. (B) Histomorphometric analysis of tibia from experiment 2 reveals increase in osteoclastic bone resorption marker (percentage of bone surface with adjacent osteoclasts) regardless of vitamin D treatment. The number of osteoclasts per bone perimeter indicated similar significant differences in samples from experiment 2 (not shown). Data are mean ± SEM; *p < .01 comparing samples from normonatremic and hyponatremic rats. (C) Representative micrographs of 5 µm thick sections from undecalcified lumbar vertebrae show osteoclasts marked by positive TRAP staining (red). Section from a normonatremic rat is from the liquid diet group, and section from a hyponatremic rat is from the liquid diet + DDAVP group. Osteoclasts are more abundant on trabecular surfaces in sections from hyponatremic rats than in sections from normonatremic rats. Bar = 200 µm.
Fig. 5
Fig. 5
Cross-sectional association between hyponatremia and the odds of osteoporosis in adults aged 50 years and older in NHANES III. Odds of osteoporosis for the total hip and femoral neck in hyponatremic relative to normonatremic adults. Osteoporosis is defined as sex-specific BMD at the hip (total and femoral neck) of 2.5 or fewer standard deviations below the mean of whites aged 20 to 29 years. Data are expressed as the adjusted odds of osteoporosis in hyponatremic relative to normonatremic participants at the two sites, with the 95% confidence interval (CI) for the estimates. Odds ratios are adjusted for age, sex, body mass index, physical activity, serum 25(OH)D3 levels (ng/mL), and diuretic use (thiazide and nonthiazide). The p values for the association of hyponatremia with osteoporosis were .043 for total hip and .003 for femoral neck.

References

    1. Upadhyay A, Jaber BL, Madias NE. Incidence and prevalence of hyponatremia. Am J Med. 2006;119:S30–35. - PubMed
    1. Kleinfeld M, Casimir M, Borra S. Hyponatremia as observed in a chronic disease facility. J Am Geriatr Soc. 1979;27:156–161. - PubMed
    1. Hawkins RC. Age and gender as risk factors for hyponatremia and hypernatremia. Clin Chim Acta. 2003;337:169–172. - PubMed
    1. Chen LK, Lin MH, Hwang SJ, Chen TW. Hyponatremia among the institutionalized elderly in two long-term care facilities in Taipei. J Chin Med Assoc. 2006;69:115–119. - PubMed
    1. Miller M, Morley JE, Rubenstein LZ. Hyponatremia in a nursing home population. J Am Geriatr Soc. 1995;43:1410–1413. - PubMed

Publication types