

Frequency spectrum of transepithelial potential difference reveals transport-related oscillations
- PMID: 19751657
- PMCID: PMC2741586
- DOI: 10.1016/j.bpj.2009.05.063
Frequency spectrum of transepithelial potential difference reveals transport-related oscillations
Abstract
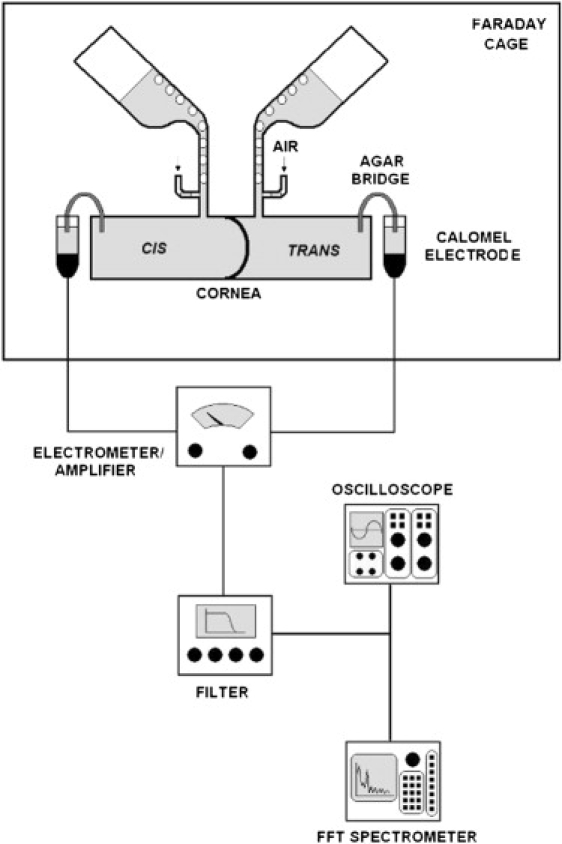
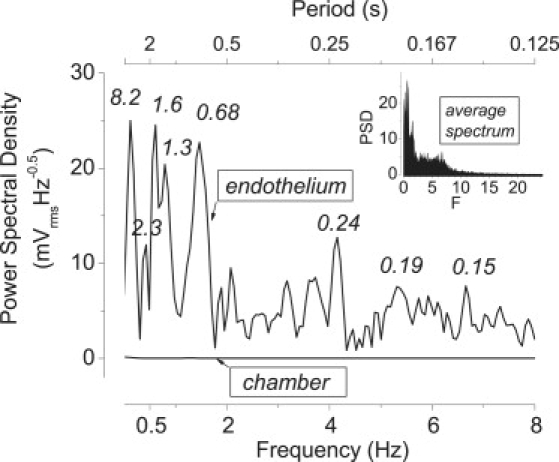
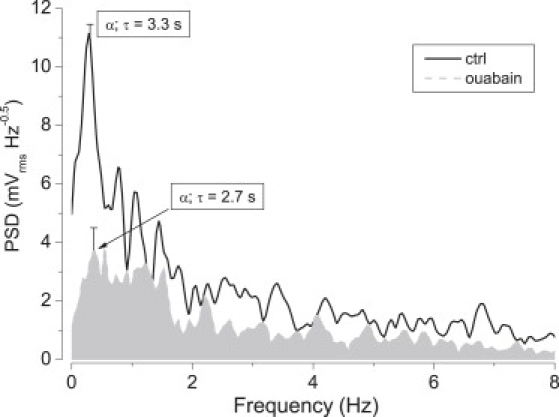
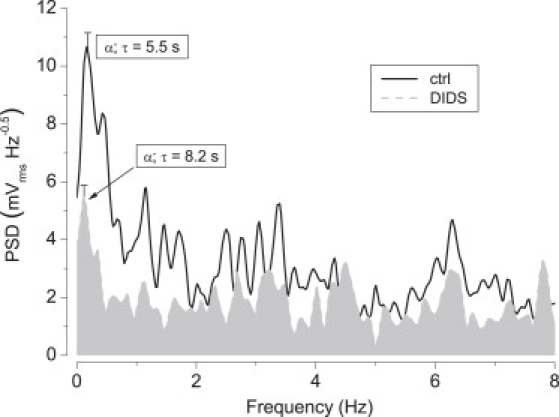
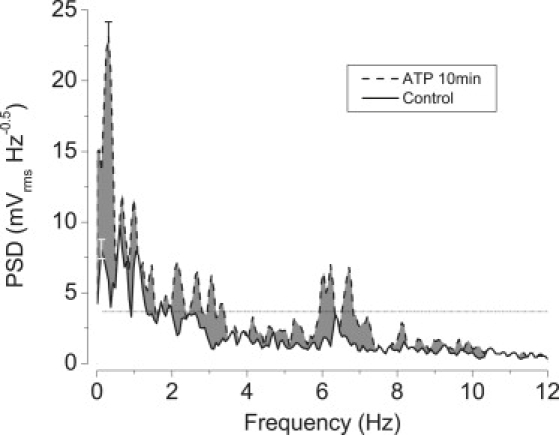
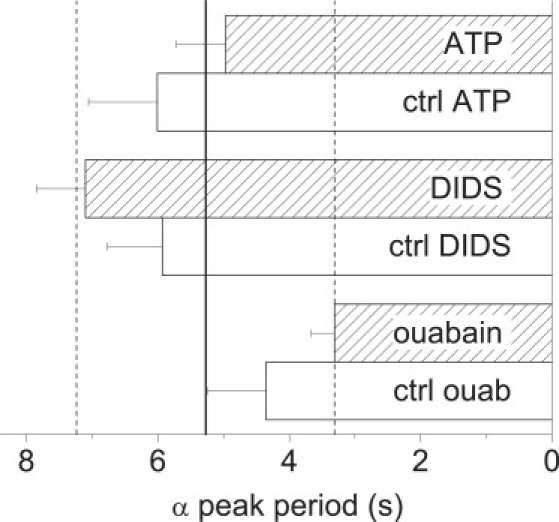
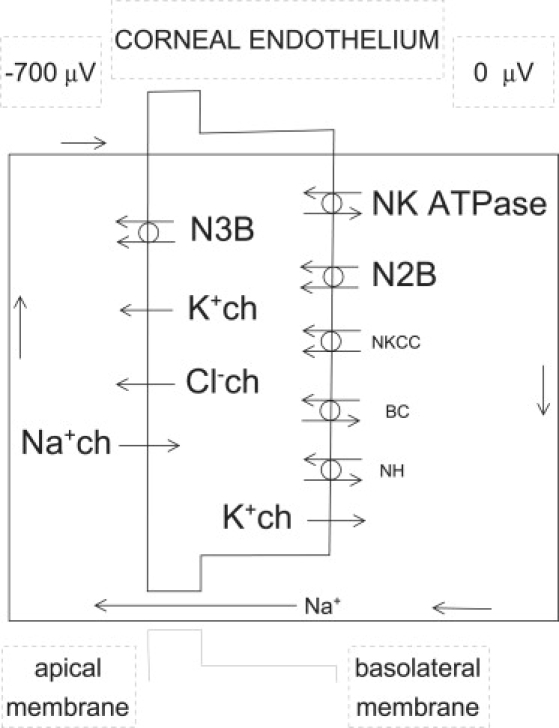
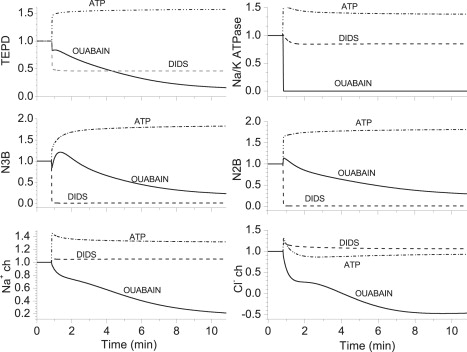
How epithelia transport fluid is a fundamental issue that is unresolved. Explanations offered include molecular engines, local transcellular osmosis, local paracellular osmosis, and paracellular fluid transport. On the basis of experimental and theoretical work done on corneal endothelium, a fluid transporting epithelium, we suggest electroosmotic coupling at the level of the intercellular junctions driven by the transendothelial electrical potential difference as an explanation of paracellular fluid transport. We collect frequency spectra of that potential difference in real-time. For what we believe is the first time for any epithelium, we report that, unexpectedly, the potential difference displays oscillations at many characteristic frequencies. We also show that on both stimulating cell activity and inhibiting ion transport mechanisms, there are corresponding changes in the oscillations amplitudes that mirror changes known previously in rates of fluid transport. We believe these findings provide a novel tool to study the kinetics of electrogenic elements such as channels and transporters, which from this evidence would give rise to current oscillations with characteristic periods going from 150 ms to 8 s.
Figures

Similar articles
-
Evidence for a central role for electro-osmosis in fluid transport by corneal endothelium.J Membr Biol. 2002 May 1;187(1):37-50. doi: 10.1007/s00232-001-0151-9. J Membr Biol. 2002. PMID: 12029376
-
The Role of the Tight Junction in Paracellular Fluid Transport across Corneal Endothelium. Electro-osmosis as a Driving Force.J Membr Biol. 2006 Mar;210(2):117-30. doi: 10.1007/s00232-005-0850-8. Epub 2006 Jul 25. J Membr Biol. 2006. PMID: 16868674 Review.
-
Fluid transport across leaky epithelia: central role of the tight junction and supporting role of aquaporins.Physiol Rev. 2010 Oct;90(4):1271-90. doi: 10.1152/physrev.00025.2009. Physiol Rev. 2010. PMID: 20959616 Review.
-
Fluid transport by cultured corneal epithelial cell layers.Br J Ophthalmol. 2000 Feb;84(2):199-204. doi: 10.1136/bjo.84.2.199. Br J Ophthalmol. 2000. PMID: 10655198 Free PMC article.
-
Role of cations, anions and carbonic anhydrase in fluid transport across rabbit corneal endothelium.J Physiol. 1974 Sep;241(3):647-75. doi: 10.1113/jphysiol.1974.sp010676. J Physiol. 1974. PMID: 4215880 Free PMC article.
Cited by
-
Synchronization modulation increases transepithelial potentials in MDCK monolayers through Na/K pumps.PLoS One. 2013 Apr 9;8(4):e61509. doi: 10.1371/journal.pone.0061509. Print 2013. PLoS One. 2013. PMID: 23585907 Free PMC article.
-
Epithelial Fluid Transport is Due to Electro-osmosis (80%), Plus Osmosis (20%).J Membr Biol. 2017 Jun;250(3):327-333. doi: 10.1007/s00232-017-9966-x. Epub 2017 Jun 16. J Membr Biol. 2017. PMID: 28623474 Free PMC article.
-
The plasma membrane potential and the organization of the actin cytoskeleton of epithelial cells.Int J Cell Biol. 2012;2012:121424. doi: 10.1155/2012/121424. Epub 2012 Jan 23. Int J Cell Biol. 2012. PMID: 22315611 Free PMC article.
-
Bioelectric Potential in Next-Generation Organoids: Electrical Stimulation to Enhance 3D Structures of the Central Nervous System.Front Cell Dev Biol. 2022 May 17;10:901652. doi: 10.3389/fcell.2022.901652. eCollection 2022. Front Cell Dev Biol. 2022. PMID: 35656553 Free PMC article. Review.
-
Net Fluorescein Flux Across Corneal Endothelium Strongly Suggests Fluid Transport is due to Electro-osmosis.J Membr Biol. 2016 Aug;249(4):469-73. doi: 10.1007/s00232-016-9887-0. Epub 2016 Mar 17. J Membr Biol. 2016. PMID: 26989056 Free PMC article.
References
-
- Zeuthen T., MacAulay N. Cotransporters as molecular water pumps. Int. Rev. Cytol. 2002;215:259–284. - PubMed
-
- Reuss L. Mechanisms of water transport across cell membranes and epithelia. In: Alpern R.J., Hebert S.C., editors. Seldin and Giebisch's The Kidney: Physiology and Pathophysiology. Elsevier Academic Press; Burlington, MA: 2008. pp. 147–168.
-
- Larsen E.H., Mobjerg N. Na+ recirculation and isosmotic transport. J. Membr. Biol. 2006;212:1–15. - PubMed
-
- Hill A.E. Fluid transport: a guide for the perplexed. J. Membr. Biol. 2008;223:1–11. - PubMed
Publication types
MeSH terms
Substances
LinkOut - more resources
Full Text Sources
