

Systematic comparative protein expression profiling of clear cell renal cell carcinoma: a pilot study based on the separation of tissue specimens by two-dimensional gel electrophoresis
- PMID: 19752005
- PMCID: PMC2816012
- DOI: 10.1074/mcp.M900168-MCP200
Systematic comparative protein expression profiling of clear cell renal cell carcinoma: a pilot study based on the separation of tissue specimens by two-dimensional gel electrophoresis
Abstract
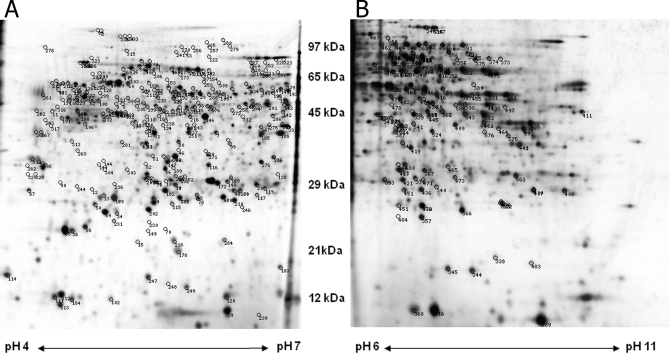
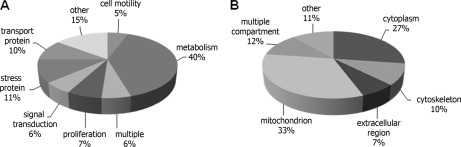
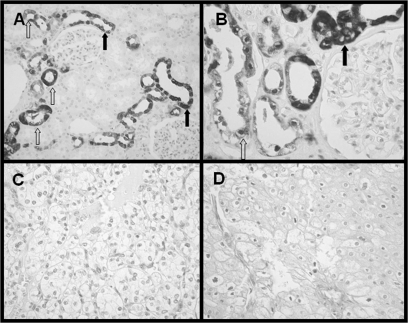
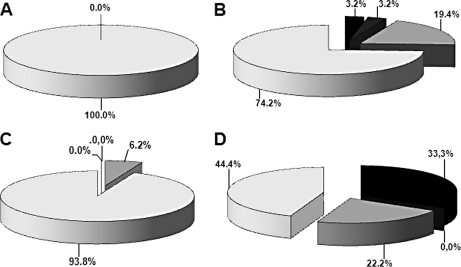
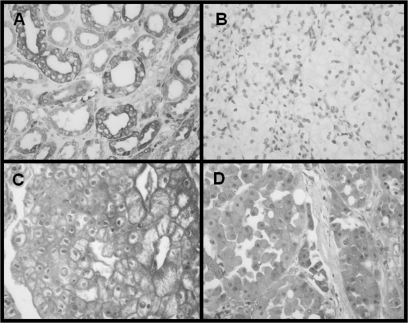
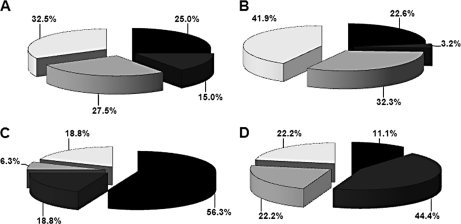
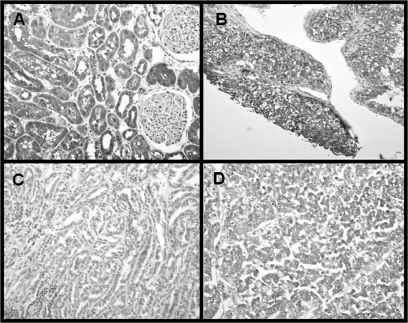
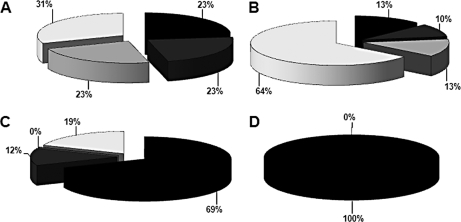
Proteome-based technologies represent powerful tools for the analysis of protein expression profiles, including the identification of potential cancer candidate biomarkers. Thus, here we provide a comprehensive protein expression map for clear cell renal cell carcinoma established by systematic comparative two-dimensional gel electrophoresis-based protein expression profiling of 16 paired tissue systems comprising clear cell renal cell carcinoma lesions and corresponding tumor-adjacent renal epithelium using overlapping narrow pH gradients. This approach led to the mapping of 348 distinct spots corresponding to 248 different protein identities. By implementing restriction criteria concerning their detection frequency and overall regulation mode, 28 up- and 56 down-regulated single target spots were considered as potential candidate biomarkers. Based on their gene ontology information, these differentially expressed proteins were classified into distinct functional groups and according to their cellular distribution. Moreover, three representative members of this group, namely calbindin, gelsolin, and heart fatty acid-binding protein, were selected, and their expression pattern was analyzed by immunohistochemistry using tissue microarrays. Thus, this pilot study provides a significant update of the current renal cell carcinoma map and defines a number of differentially expressed proteins, but both their potential as candidate biomarkers and clinical relevance has to be further explored in tissues and for body fluids like serum and urine.
Figures
Similar articles
-
Combined analysis of transcriptome and proteome data as a tool for the identification of candidate biomarkers in renal cell carcinoma.Proteomics. 2009 Mar;9(6):1567-81. doi: 10.1002/pmic.200700288. Proteomics. 2009. PMID: 19235166 Free PMC article.
-
Proteomic analysis reveals differentially secreted proteins in the urine from patients with clear cell renal cell carcinoma.Urol Oncol. 2016 Jan;34(1):5.e11-25. doi: 10.1016/j.urolonc.2015.07.016. Epub 2015 Sep 26. Urol Oncol. 2016. PMID: 26420021
-
Proteomic analysis in clear cell renal cell carcinoma: identification of differentially expressed protein by 2-D DIGE.Mol Biosyst. 2012 Apr;8(4):1040-51. doi: 10.1039/c2mb05390j. Epub 2012 Feb 8. Mol Biosyst. 2012. PMID: 22315040
-
Candidate biomarkers in renal cell carcinoma.Proteomics. 2007 Dec;7(24):4601-12. doi: 10.1002/pmic.200700415. Proteomics. 2007. PMID: 18072195 Review.
-
Detection of renal cell carcinoma-associated markers via proteome- and other 'ome'-based analyses.Brief Funct Genomic Proteomic. 2003 Oct;2(3):194-212. doi: 10.1093/bfgp/2.3.194. Brief Funct Genomic Proteomic. 2003. PMID: 15239923 Review.
Cited by
-
Distinct von Hippel-Lindau gene and hypoxia-regulated alterations in gene and protein expression patterns of renal cell carcinoma and their effects on metabolism.Oncotarget. 2015 May 10;6(13):11395-406. doi: 10.18632/oncotarget.3456. Oncotarget. 2015. PMID: 25890500 Free PMC article.
-
Identification of AK4 as a novel therapeutic target for serous ovarian cancer.Oncol Lett. 2020 Dec;20(6):346. doi: 10.3892/ol.2020.12209. Epub 2020 Oct 8. Oncol Lett. 2020. PMID: 33123257 Free PMC article.
-
iTRAQ Quantitative Proteomic Comparison of Metastatic and Non-Metastatic Uveal Melanoma Tumors.PLoS One. 2015 Aug 25;10(8):e0135543. doi: 10.1371/journal.pone.0135543. eCollection 2015. PLoS One. 2015. PMID: 26305875 Free PMC article.
-
Proteomic approaches for characterizing renal cell carcinoma.Clin Proteomics. 2020 Jul 29;17:28. doi: 10.1186/s12014-020-09291-w. eCollection 2020. Clin Proteomics. 2020. PMID: 32742246 Free PMC article. Review.
-
[Quantitative and comparative proteomics analysis in clear cell renal cell carcinoma and adjacent noncancerous tissues by 2-D DIGE].Nan Fang Yi Ke Da Xue Xue Bao. 2017 Nov 20;37(11):1517-1522. doi: 10.3969/j.issn.1673-4254.2017.11.15. Nan Fang Yi Ke Da Xue Xue Bao. 2017. PMID: 29180334 Free PMC article. Chinese.
References
-
- Drucker B. J. ( 2005) Renal cell carcinoma: current status and future prospects. Cancer Treat. Rev 31, 536– 545 - PubMed
-
- Pantuck A. J., Zisman A., Belldegrun A. S. ( 2001) The changing natural history of renal cell carcinoma. J. Urol 166, 1611– 1623 - PubMed
-
- Yang J. C., Childs R. ( 2006) Immunotherapy for renal cell cancer. J. Clin. Oncol 24, 5576– 5583 - PubMed
-
- Kerst J. M., Bex A., Mallo H., Dewit L., Haanen J. B., Boogerd W., Teertstra H. J., de Gast G. C. ( 2005) Prolonged low dose IL-2 and thalidomide in progressive metastatic renal cell carcinoma with concurrent radiotherapy to bone and/or soft tissue metastasis: a phase II study. Cancer Immunol. Immunother 54, 926– 931 - PMC - PubMed
-
- Motzer R. J., Bukowski R. M. ( 2006) Targeted therapy for metastatic renal cell carcinoma. J. Clin. Oncol 24, 5601– 5608 - PubMed
Publication types
MeSH terms
Substances
LinkOut - more resources
Full Text Sources
Medical
Research Materials
Miscellaneous
