. 2009 Sep 21;186(6):793-803.
doi: 10.1083/jcb.200906098. Epub 2009 Sep 14.

Coassembly of Mgm1 isoforms requires cardiolipin and mediates mitochondrial inner membrane fusion

Affiliations

Coassembly of Mgm1 isoforms requires cardiolipin and mediates mitochondrial inner membrane fusion

Rachel M DeVay et al. J Cell Biol. .

Abstract

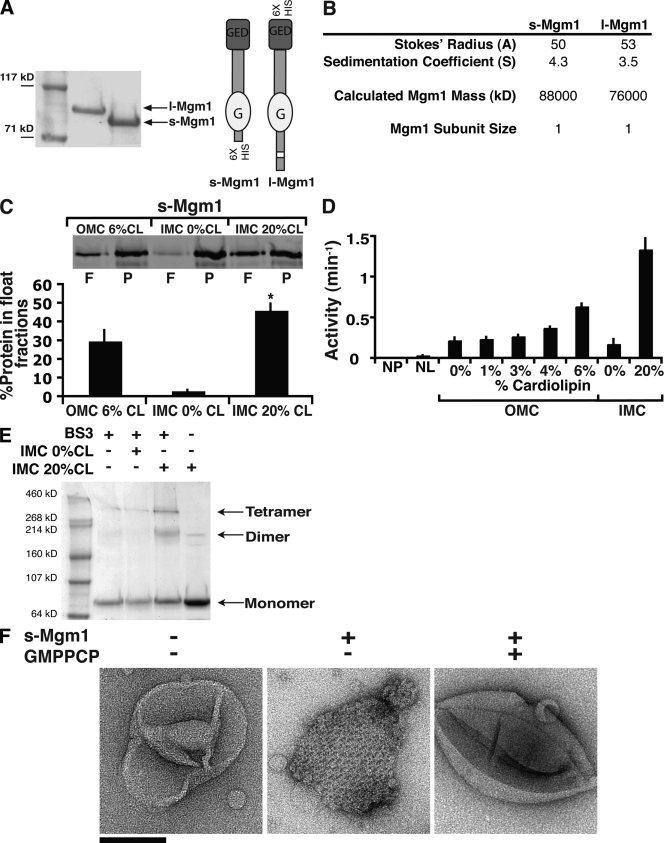
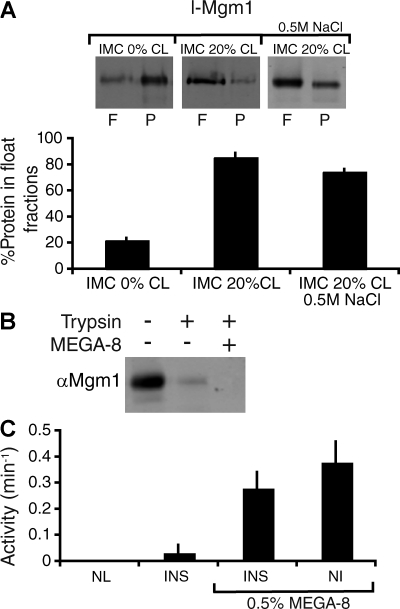
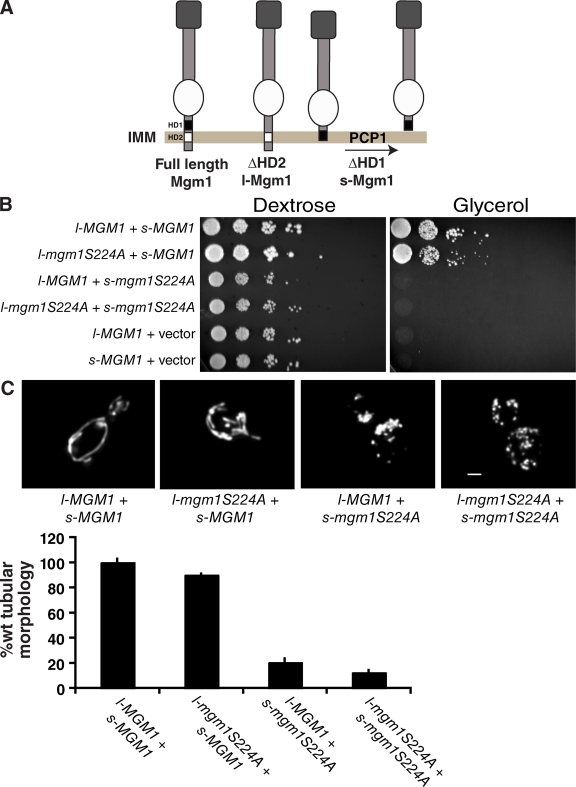
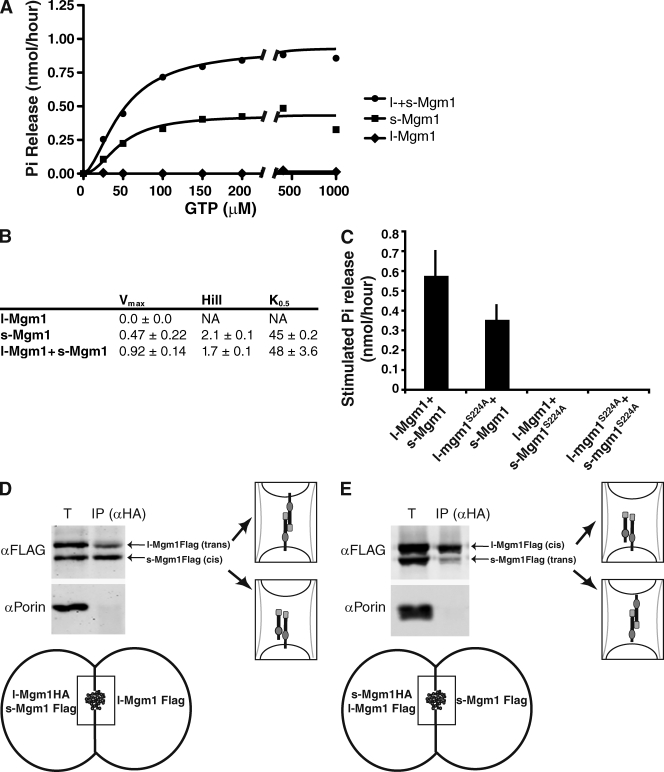
Two dynamin-related protein (DRP) families are essential for fusion of the outer and inner mitochondrial membranes, Fzo1 (yeast)/Mfn1/Mfn2 (mammals) and Mgm1 (yeast)/Opa1 (mammals), respectively. Fzo1/Mfns possess two medial transmembrane domains, which place their critical GTPase and coiled-coil domains in the cytosol. In contrast, Mgm1/Opa1 are present in cells as long (l) isoforms that are anchored via the N terminus to the inner membrane, and short (s) isoforms were predicted to be soluble in the intermembrane space. We addressed the roles of Mgm1 isoforms and how DRPs function in membrane fusion. Our analysis indicates that in the absence of a membrane, l- and s-Mgm1 both exist as inactive GTPase monomers, but that together in trans they form a functional dimer in a cardiolipin-dependent manner that is the building block for higher-order assemblies.


Figures

Figure 1.
Figure 1.
s-Mgm1 assembly is regulated by CL. (A) Purified l- and s-Mgm1 (40 pmol of each) analyzed by SDS-PAGE. Schematic representations of Mgm1 isoforms are shown (right). (B) Hydrodynamic analysis of l- and s-Mgm1. (C) s-Mgm1 preferentially associates with IMC liposomes. 0.5 µM s-Mgm1 was incubated with OMC 6% CL, IMC 0% CL, or IMC 20% CL liposomes and analyzed by floatation in sucrose gradients. A representative SDS-PAGE and Western analysis of float (F) and pellet (P) fractions is shown. Quantification from three experiments is shown as the mean + SEM (error bars). (D) 1 µM s-Mgm1 was analyzed alone (NL, no liposomes; NP, no protein) or preincubated with liposomes of OMC or IMC composition with CL present at the indicated amounts. Data from three experiments are shown as the mean + SEM (error bars). (E) s-Mgm1 self-assembles as a dimer. A representative SDS-PAGE Coomassie-stained gel of chemically cross-linked s-Mgm1 under indicated conditions is shown. (F) s-Mgm1 assembles into lattices in a GTP-regulated manner. Negative-stain EM analysis of IMC 20% CL liposomes with or without 1 µM s-Mgm1 as indicated. Bar, 200 nm.
Figure 2.
Figure 2.
Structural analysis of s-Mgm1. (A) EM analysis of a negatively stained 2D crystal of s-Mgm1. The power spectrum calculated from the raw image is shown in the inset and shows strong diffraction up to 3 nm resolution. (B) P3 symmetrized projection map of s-Mgm1, calculated from merged data from nine processed images of negatively stained s-Mgm1 2D crystals. 2 × 2 unit cells are shown. One unit cell has dimensions of a = b = 200 Å, γ = 120°. (C) 3D reconstruction from images of tilted negatively stained 2D crystals of s- Mgm1 as seen from the direction perpendicular to the membrane plane. 2 × 2 unit cells are shown. (D) Homology model for s-Mgm1. This model was created using Modeller (Martí-Renom et al., 2000) and is based on the structures of dynamin A, dynamin-1, and a bacterial dynamin-like protein (PDB accession nos. 1JWY, 2AKA, and 2J69). The monomer is depicted as seen from the dimer interface. The model is color coded as follows: the GTPase domains is yellow, the GED is blue, and the pair of helices that putatively bind the membrane are orange. GDP–Mg complexes are depicted as spheres. (E) Schematic representation of the proposed parallel s-Mgm1 dimer bound to a lipid bilayer. The homology-modeled dimer and the corresponding 3D reconstruction based on the 2D crystallographic data are shown at the same scale. One monomer is colored as in D. Bars: (A) 200 nm; (C) 10 nm; (E) 5 nm.
Figure 3.
Figure 3.
l-Mgm1 GTPase activity is inhibited when inserted into a membrane bilayer. (A) l-Mgm1 inserts into IMC liposomes. l-Mgm1 was reconstituted into IMC 0% (left) and IMC 20% CL (right) liposomes as described in Materials and methods and fractionated by floatation on sucrose gradients. A 0.5 M NaCl treatment was performed to remove uninserted l-Mgm1 before floatation (right). A representative SDS-PAGE and Western blot of equivalent amounts of the float (F) and pellet (P) fractions is shown. Quantification from three experiments is shown as the mean + SEM (error bars). (B) l-Mgm1 inserts in the correct orientation in IMC liposomes. Reconstituted l-Mgm1 liposomes were treated with trypsin in the presence and absence of MEGA-8 as described (see Materials and methods). (C) GTPase activity of l-Mgm1 was determined as described alone (left; NL, no lipids), after reconstitution into IMC 20% CL liposomes (left; INS), after reconstitution into IMC 20% CL liposomes and subsequent addition of 0.5% MEGA-8 (right; INS), and upon addition of detergent-solubilized l-Mgm1 to IMC 20% CL liposomes (right; NI). Data from three experiments are shown as the mean + SEM (error bars).
Figure 4.
Figure 4.
The GTPase activity of l-Mgm1 is not essential for fusion in vivo. (A) Schematic of in vivo l- and s-Mgm1 constructs. Isoforms were constructed by deletion of the first hydrophobic domain (HD1) to produce s-Mgm1 and the second hydrophobic domain (HD2) to produce l-Mgm1. l-Mgm1S224A is functional in vivo as assessed by growth of yeast strains on glycerol media (B) and by mitochondrial morphology (C). Bar, 1 µm. A quantification of mitochondrial morphology in Δmgm1 cells expressing the indicated l- and s-Mgm1 combinations is shown. Data were normalized to Δmgm1 + l-Mgm1 + s-Mgm1 and are shown as the mean + SEM (error bars; three experiments, >50 cells/experiment).
Figure 5.
Figure 5.
l-Mgm1 stimulates s-Mgm1 GTPase activity. (A) Kinetics of GTP hydrolysis of l-Mgm1, s-Mgm1, and l- + s-Mgm1 (s-Mgm1, 0.5 µM; l-Mgm1, 0.3 µM). A representative kinetic plot fit to the Hill equation is shown. (B) Kinetic parameters for l-Mgm1, s-Mgm1, and l- + s-Mgm1. (C) GTP hydrolysis of s-Mgm1 is stimulated by reconstituted l-Mgm1. The indicated combinations of s- and l-Mgm1/IMC liposomes were analyzed as described in Materials and methods. l- and s-Mgm1–stimulated phosphate release was calculated by subtracting phosphate released for each individual protein from phosphate released when combined. Data from three experiments are shown as the mean + SEM (error bars). (D and E) l- and s-Mgm1 interact in mitochondrial outer membrane fused intermediates in vitro. In outer membrane fused intermediates in vitro, l-Mgm1HA (D) or s-Mgm1HA (E) was immunoprecipitated using α-HA antibodies, and coimmunoprecipitated proteins were analyzed by SDS-PAGE and Western analysis with the indicated antibodies as described (see Materials and methods). l-Mgm1HA/s-Mgm1Flag (cis), l-Mgm1Flag/l-Mgm1Flag (trans), l-Mgm1HA/l-Mgm1Flag (trans), and s-Mgm1HA/s-Mgm1Flag (trans) complexes were detected and are depicted schematically.

References

    1. Cipolat S., Rudka T., Hartmann D., Costa V., Serneels L., Craessaerts K., Metzger K., Frezza C., Annaert W., D'Adamio L., et al. 2006. Mitochondrial rhomboid PARL regulates cytochrome c release during apoptosis via OPA1-dependent cristae remodeling.Cell. 126:163–175 doi:10.1016/j.cell.2006.06.021 - DOI - PubMed
    1. Crowther R.A., Henderson R., Smith J.M. 1996. MRC image processing programs.J. Struct. Biol. 116:9–16 doi:10.1006/jsbi.1996.0003 - DOI - PubMed
    1. Danino D., Hinshaw J.E. 2001. Dynamin family of mechanoenzymes.Curr. Opin. Cell Biol. 13:454–460 doi:10.1016/S0955-0674(00)00236-2 - DOI - PubMed
    1. Daum G., Vance J.E. 1997. Import of lipids into mitochondria.Prog. Lipid Res. 36:103–130 doi:10.1016/S0163-7827(97)00006-4 - DOI - PubMed
    1. Duvezin-Caubet S., Jagasia R., Wagener J., Hofmann S., Trifunovic A., Hansson A., Chomyn A., Bauer M.F., Attardi G., Larsson N., et al. 2006. Proteolytic processing of OPA1 links mitochondrial dysfunction to alterations in mitochondrial morphology. J. Biol Chem.J. Biol. Chem. 281:37972–37979 - PubMed

Publication types

MeSH terms