. 2009 Nov 1;587(Pt 21):5163-76.
doi: 10.1113/jphysiol.2009.179820. Epub 2009 Sep 14.

Interactions between short-interval intracortical inhibition and short-latency afferent inhibition in human motor cortex

Affiliations

Interactions between short-interval intracortical inhibition and short-latency afferent inhibition in human motor cortex

Henrik Alle et al. J Physiol. .

Abstract

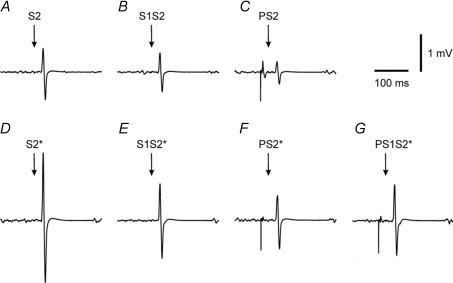
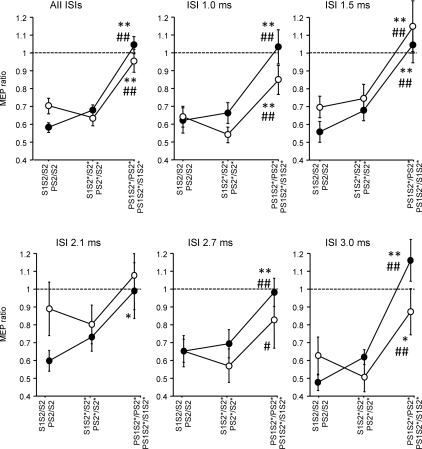
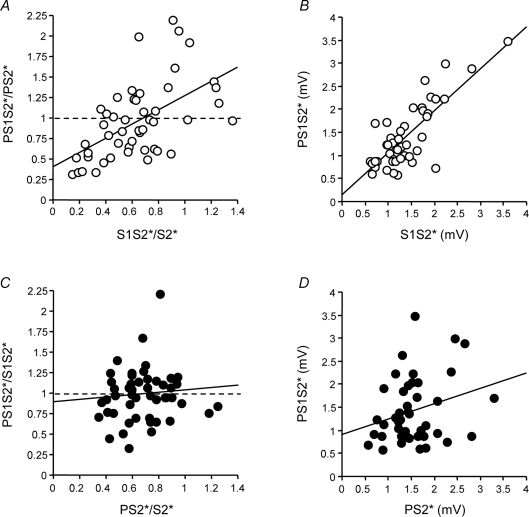
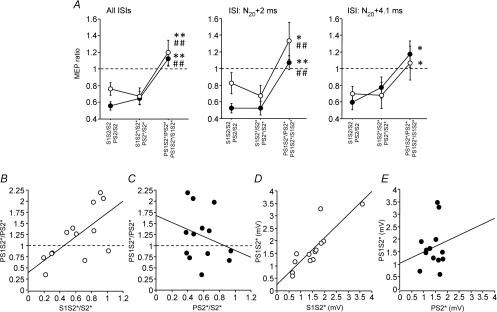
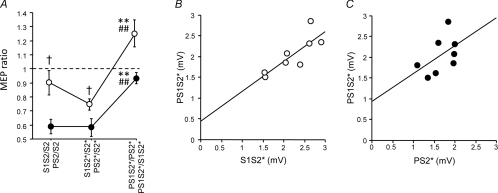
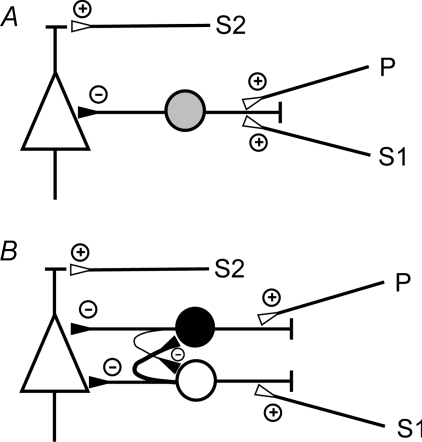
Transcranial magnetic stimulation (TMS) allows the testing of various inhibitory processes in human motor cortex. Here we aimed at gaining more insight into the underlying physiology by studying the interactions between short-interval intracortical inhibition (SICI) and short-latency afferent inhibition (SAI). SICI and SAI were examined in a slightly contracting hand muscle of healthy subjects by measuring inhibition of a test motor-evoked potential conditioned by a sub-threshold motor cortical magnetic pulse (S1) or an electrical pulse (P) applied to the ulnar nerve at the wrist, respectively. SICI alone and SAI alone had similar magnitude when S1 intensity was set to 90% active motor threshold and P intensity to three times the perceptual sensory threshold. SICI was reduced or even disinhibited when P was co-applied, and SAI was reduced or disinhibited when S1 was co-applied. These interactions did not depend on the exact timing of arrival of P and S1 in motor cortex. A control experiment with a S1 intensity lowered to 70% active motor threshold excluded a contribution by short-interval intracortical facilitation. Finally, SICI with co-applied P correlated linearly with SICI alone with a slope of the regression line close to 1 whereas SAI did not correlate with SAI when S1 was co-applied with a slope of the regression line close to zero. Data indicate that S1 largely eliminates the effects of P when applied together, suggesting dominance of S1 over P. Findings strongly support the idea that SICI and SAI are mediated through two distinct and reciprocally connected subtypes of GABAergic inhibitory interneurons with convergent projections onto the corticospinal neurons. Furthermore, dominance of S1 over P is compatible with the notion that the SICI interneurons target the corticospinal neurons closer to their axon initial segment than the SAI interneurons.


Figures

Figure 1
Figure 1. Interactions between SICI and SAI in one subject (Experiment 1)
All traces are averages of 10 trials of EMG recordings from the contracting right ADM of one representative subject. Conditions in A–G correspond to conditions A–G in Table 1. From these data the following MEP ratios were calculated: SICI alone (S1S2/S2 = 0.76; S1S2*/S2*= 0.57), SICI with co-applied P (PS1S2*/PS2*= 1.32), SAI alone (PS2/S2 = 0.43; PS2*/S2*= 0.41), and SAI with co-applied S1 (PS1S2*/S1S2*= 0.95). Note the match of MEP amplitude between S2 and PS2*.
Figure 2
Figure 2. Interactions between SICI and SAI – effects of the interval between S1 and S2 (Experiment 1)
SICI alone (S1S2/S2, S1S2*/S2*) vs. SICI with co-applied P (PS1S2*/PS2*, open circles) and SAI alone (PS2/S2, PS2*/S2*) vs. SAI with co-applied S1 (PS1S2*/S1S2*, filled circles) are shown as grand average across all ISIs between S1 and S2, and separately for the single ISIs (1.0, 1.5, 2.1, 2.7 and 3.0 ms). Values less than 1 (dashed horizontal lines) indicate inhibition. S1 inhibited PS2* significantly less than S2 or S2* alone, irrespective of ISI. In some instances, PS1S2*/PS2* even resulted in values larger than 1, indicating disinhibition. Similarly, P inhibited S1S2* significantly less than S2 or S2* alone, irrespective of ISI. Again, in some instances PS1S2*/S1S2* resulted in values larger than 1, indicating disinhibition. Significant differences between PS1S2*/PS2* and S1S2/S2, or between PS1S2*/S1S2* and PS2/S2 are indicated by * (P < 0.05) or ** (P < 0.01). Significant differences between PS1S2*/PS2* and S1S2*/S2*, or between PS1S2*/S1S2* and PS2*/S2* are indicated by # (P < 0.05) or ## (P < 0.01). All data are means ± 1 s.e.m. of 10 subjects.
Figure 3
Figure 3. Correlations between SICI without vs. with co-applied P (A), between SAI without vs. with co-applied S1 (C), and between MEP amplitude of S1S2* (B) or PS2* (D) with MEP amplitude of PS1S2* (Experiment 1)
A, SICI alone (S1S2*/S2*) is plotted against SICI with co-applied P (PS1S2*/PS2*). Each data point is from one single subject (n= 10) and one ISI between S1 and S2 (5 different ISIs). Values less than 1 (dashed line) indicate inhibition. The thick continuous line is the regression line. B, MEP amplitude (in mV) of S1S2* is plotted against that of PS1S2*. C, SAI alone (PS2*/S2*) is plotted against SAI with co-applied S1 (PS1S2*/S1S2*). D, MEP amplitude (in mV) of PS2* is plotted against that of PS1S2*. Arrangement and conventions in B–D are otherwise the same as in A.
Figure 4
Figure 4. Interactions between SICI and SAI – effects of the interval between P and S2 (Experiment 2)
A, SICI alone (S1S2/S2, S1S2*/S2*) vs. SICI with co-applied P (PS1S2*/PS2*, open circles) and SAI alone (PS2/S2, PS2*/S2*) vs. SAI with co-applied S1 (PS1S2*/S1S2*, filled circles) are shown as grand average across the two tested ISIs between P and S2, and separately for the single ISIs (N20+ 2 ms, N20+ 4.1 ms). Values less than 1 (dashed lines) indicate inhibition. S1 inhibited PS2* significantly less than S2 or S2* alone, irrespective of ISI. In some instances, PS1S2*/PS2* even resulted in values larger than 1, indicating disinhibition. Similarly, P inhibited S1S2* significantly less than S2 or S2* alone, irrespective of ISI. Again, in some instances PS1S2*/S1S2* resulted in values larger than 1, indicating disinhibition. Significant differences between PS1S2*/PS2* and S1S2/S2, or between PS1S2*/S1S2* and PS2/S2 are indicated by * (P < 0.05) or ** (P < 0.01). Significant differences between PS1S2*/PS2* and S1S2*/S2*, or between PS1S2*/S1S2* and PS2*/S2* are indicated by # (P < 0.05) or ## (P < 0.01). All data are means ± 1 s.e.m. of 7 subjects. B, SICI alone (S1S2*/S2*) is plotted against SICI with co-applied P (PS1S2*/PS2*). Each data point is from one single subject (n= 7) and one ISI between P and S2 (2 different ISIs). Values less than 1 (dashed line) indicate inhibition. The thick continuous line is the regression line. C, SAI alone (PS2*/S2*) is plotted against SAI with co-applied S1 (PS1S2*/S1S2*). D, MEP amplitude (in mV) of S1S2* is plotted against that of PS1S2*. E, MEP amplitude (in mV) of PS2* is plotted against that of PS1S2*. Arrangement and conventions in C–E are otherwise the same as in B.
Figure 5
Figure 5. SICI without vs. with co-applied P, and SAI without vs. with co-applied S1 at a reduced S1 intensity of 70% AMT (Experiment 3)
A, SICI alone (S1S2/S2, S1S2*/S2*) vs. SICI with co-applied P (PS1S2*/PS2*, open circles) and SAI alone (PS2/S2, PS2*/S2*) vs. SAI with co-applied S1 (PS1S2*/S1S2*, filled circles) are shown. Values less than 1 (dashed horizontal line) indicate inhibition. S1 inhibited PS2* significantly less than S2 or S2* alone. Similarly, P inhibited S1S2* significantly less than S2 or S2* alone. Significant differences between PS1S2*/PS2* and S1S2/S2, and between PS1S2*/S1S2* and PS2/S2 are indicated by ** (P < 0.01). Significant differences between PS1S2*/PS2* and S1S2*/S2*, and between PS1S2*/S1S2* and PS2*/S2* are indicated by ## (P < 0.01). Significant differences between S1S2/S2 vs. PS2/S2, and between S1S2*/S2*vs. PS2*/S2* are indicated by † (P > 0.05). All data are means ± 1 s.e.m. of 8 subjects. B, MEP amplitude (in mV) of S1S2* is plotted against that of PS1S2* with the regression line indicated. C, MEP amplitude (in mV) of PS2* is plotted against that of PS1S2* with the regression line indicated.
Figure 6
Figure 6. Simple connectivity models to explain the interactions between SICI and SAI
A, the excitatory input pathways of SICI and SAI converge onto the same inhibitory interneuron (grey circle), which in turn synapses onto a corticospinal neuron (triangle). B, the excitatory input pathways of SICI and SAI synapse onto distinct subtypes of inhibitory interneurons (black and white circle), which in turn synapse onto a common corticospinal neuron (triangle) with the SICI input located closer to the axon initial segment than the SAI input. The interneurons mutually inhibit each other, with a stronger inhibition from the SICI interneuron onto the SAI interneuron (symbolized by a thicker axon) than the other way round. Small circles with a plus indicate excitatory synapses, while small circles with a minus indicate inhibitory synapses. In addition, both models contain an excitatory input to the corticospinal neuron, which when activated by S2 results in elicitation of a test MEP.

References

    1. Chen R. Interactions between inhibitory and excitatory circuits in the human motor cortex. Exp Brain Res. 2004;154:1–10. - PubMed
    1. Chen R, Cros D, Curra A, Di Lazzaro V, Lefaucheur JP, Magistris MR, Mills K, Rösler KM, Triggs WJ, Ugawa Y, Ziemann U. The clinical diagnostic utility of transcranial magnetic stimulation: Report of an IFCN committee. Clin Neurophysiol. 2008;119:504–532. - PubMed
    1. Daskalakis ZJ, Christensen BK, Fitzgerald PB, Roshan L, Chen R. The mechanisms of interhemispheric inhibition in the human motor cortex. J Physiol. 2002;543:317–326. - PMC - PubMed
    1. Daskalakis ZJ, Paradiso GO, Christensen BK, Fitzgerald PB, Gunraj C, Chen R. Exploring the connectivity between the cerebellum and motor cortex in humans. J Physiol. 2004;557:689–700. - PMC - PubMed
    1. Di Lazzaro V, Oliviero A, Meglio M, Cioni B, Tamburrini G, Tonali P, Rothwell JC. Direct demonstration of the effect of lorazepam on the excitability of the human motor cortex. Clin Neurophysiol. 2000a;111:794–799. - PubMed

LinkOut - more resources