. 2009 Sep 15:3:92.
doi: 10.1186/1752-0509-3-92.

A systems biology framework for modeling metabolic enzyme inhibition of Mycobacterium tuberculosis

Affiliations

A systems biology framework for modeling metabolic enzyme inhibition of Mycobacterium tuberculosis

Xin Fang et al. BMC Syst Biol. .

Abstract

Background: Because metabolism is fundamental in sustaining microbial life, drugs that target pathogen-specific metabolic enzymes and pathways can be very effective. In particular, the metabolic challenges faced by intracellular pathogens, such as Mycobacterium tuberculosis, residing in the infected host provide novel opportunities for therapeutic intervention.

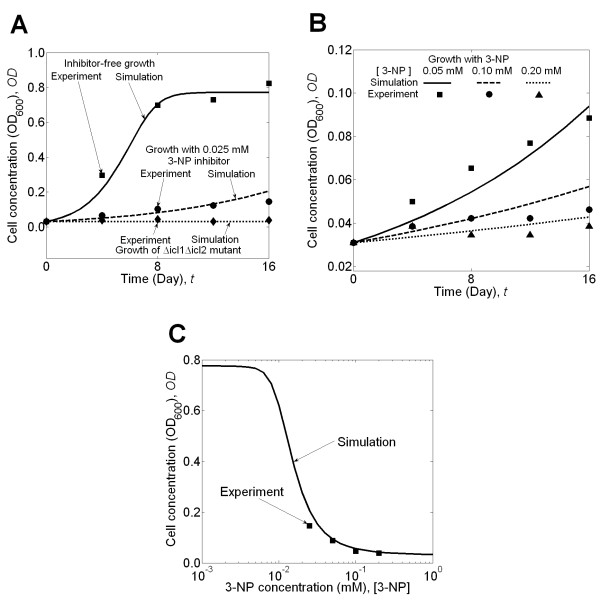
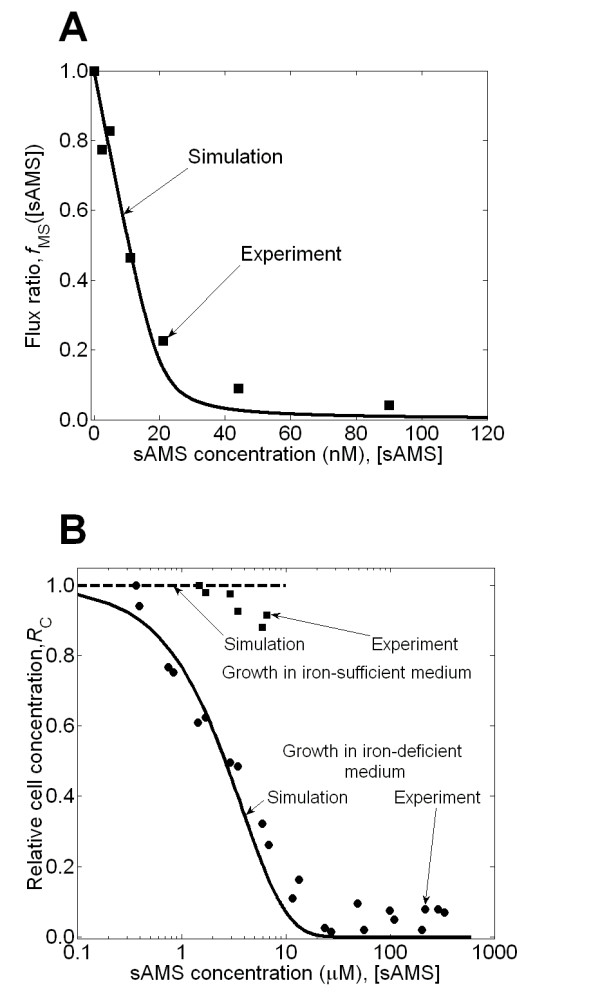
Results: We developed a mathematical framework to simulate the effects on the growth of a pathogen when enzymes in its metabolic pathways are inhibited. Combining detailed models of enzyme kinetics, a complete metabolic network description as modeled by flux balance analysis, and a dynamic cell population growth model, we quantitatively modeled and predicted the dose-response of the 3-nitropropionate inhibitor on the growth of M. tuberculosis in a medium whose carbon source was restricted to fatty acids, and that of the 5'-O-(N-salicylsulfamoyl) adenosine inhibitor in a medium with low-iron concentration.

Conclusion: The predicted results quantitatively reproduced the experimentally measured dose-response curves, ranging over three orders of magnitude in inhibitor concentration. Thus, by allowing for detailed specifications of the underlying enzymatic kinetics, metabolic reactions/constraints, and growth media, our model captured the essential chemical and biological factors that determine the effects of drug inhibition on in vitro growth of M. tuberculosis cells.


Figures

Figure 1
Figure 1
A schematic view of the framework to simulate an inhibitor's effect on bacterial growth. Given the inhibitor concentration [I], the Inhibition Model describes how the inhibitor affects the reaction flux of the reaction being inhibited (i.e., the target reaction). These effects are modeled via explicit constraints on the target reaction flux. Using these constraints and the constraints on substrate uptake rate formula image
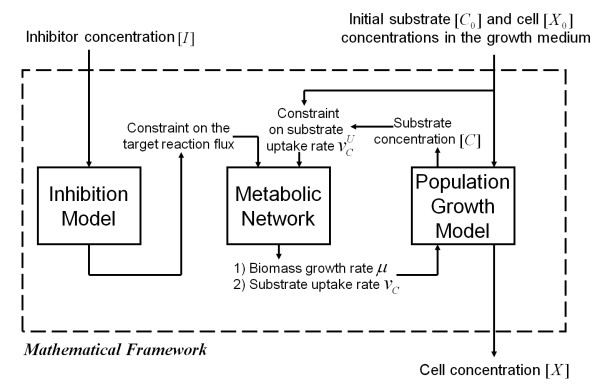
, we analyzed the Metabolic Network to infer the biomass growth rate μ and substrate uptake rate vC. Using the Population Growth Model, we related biomass growth rate μ and substrate uptake rate vC to cell concentration [X]. We dynamically coupled the biomass growth rate and the diminished substrate concentration to develop a time-dependent model that dynamically infers cell concentration after the introduction of an inhibitor. Once these model components were specified, together with the initial substrate [C0] and cell [X0] concentrations in the growth medium, the calculations performed within this framework only required input in the form of a specific inhibitor concentration [I] to predict cellular growth.
Figure 2
Figure 2
The pathways for utilizing fatty acids, showing the target reactions of the 3-nitropropionate (3-NP) inhibitor. The fatty acid pathways include the tricarboxylic acid cycle marked by the solid line (oxaloacetate → isocitrate → α-ketoglutarate → succinate → malate → oxaloacetate), the glyoxylate cycle marked by the dashed line (oxaloacetate → isocitrate → glyoxylate → malate → oxaloacetate), and the methylcitrate cycle marked by the dash-dotted line (oxaloacetate → methylcitrate → methylisocitrate → succinate → malate → oxaloacetate). 3-NP inhibits the enzymes that catalyze the reactions involved in converting isocitrate and methylisocitrate to succinate. CoA = coenzyme A.
Figure 3
Figure 3
Results from the mathematical framework used to study the inhibitory effects of 3-nitropropionate (3-NP). (A) Cell concentration, expressed in units of optical density at 600-nm-wavelength light (OD600), of Mycobacterium tuberculosis in inhibitor-free medium (solid line), in medium with 0.025 mM 3-NP (dashed line), and cell concentrations of the Δicl1 Δicl2 mutant bacterium (dotted line) obtained from our calculation using the described mathematical framework and compared to the corresponding experimental results [46]; (B) The calculated cell concentration, expressed as OD600, of M. tuberculosis is shown as a function of time for different 3-NP inhibitor concentrations and compared to the corresponding experimental data [46]; and (C) The calculated cell concentration, expressed as OD600, of M. tuberculosis after a 16-day growth period as a function of 3-NP inhibitor concentration compared to experimental values [46].
Figure 4
Figure 4
The influence of the parameter values on the calculated dose-response curve. Sensitivity analysis of the calculated cell concentration, expressed in units of optical density at 600-nm-wavelength light (OD600), of Mycobacterium tuberculosis after a 16-day growth period as a function of 3-nitropropionate (3-NP) concentration. The analysis was performed for the parameters set to their original values (solid lines), those values increased by 50% (dotted lines). (A-G) Sensitivity of the dose-response curves for variations in the values of the (A) succinate concentration [SUC]; (B) ICL1-catalyzed fraction of the overall inhibitor-free MCL reaction flux wMCL1; (C) initial propionate concentration [C'] (t = 0); (D) maximum initial propionate uptake rate Vm; (E) Michaelis-Menten rate constant for the propionate uptake formula image
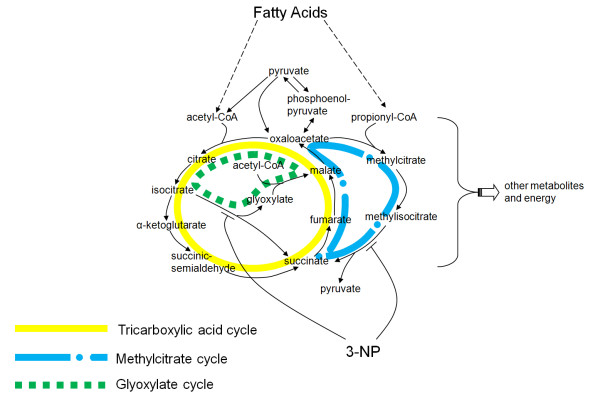
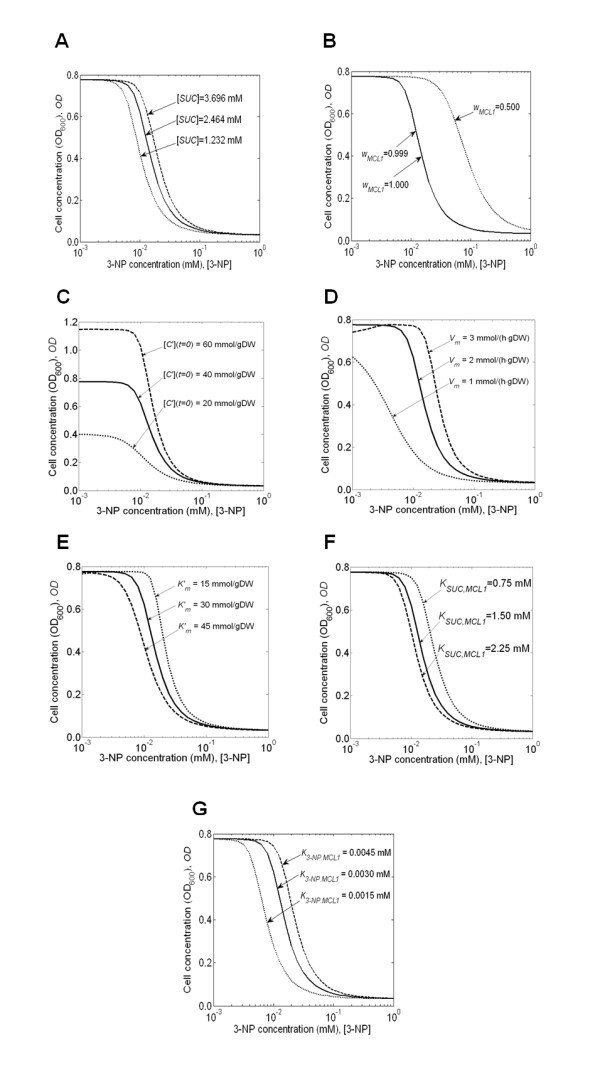
; (F) Michaelis-Menten rate constant KSUC,MCL1; and (G) Michaelis-Menten rate constant K3-NP,MCL1.
Figure 5
Figure 5
The metabolic pathways involved in the mycobactin synthesis and subsequent iron uptake. The target reaction for the 5'-O-(N-salicylsulfamoyl) adenosine (sAMS) inhibitor is indicated at the top right. The connection to the metabolic pathways inhibited by 3-nitropropionate (3-NP) in Figure 2 is shown at the lower left. Note that only parts of the metabolic network are indicated in the figure. The entire network consists of 830 metabolites and 1,031 reactions.
Figure 6
Figure 6
Results for the study of the inhibitory effects of 5'-O-(N-salicylsulfamoyl) adenosine (sAMS). (A) The flux ratio fMS of the mycobactin synthesis reaction as measured in the cell-fee reaction assay as a function of sAMS concentration [sAMS]. The calculated values (solid line) using the inhibition model given in Eq. 15 are in good agreement with the experimentally determined values (squares) [53]. (B) The calculated relative cell concentration RC of Mycobacterium tuberculosis as a function of sAMS inhibitor concentration [sAMS] in iron-deficient and iron-sufficient medium compared to the experimental data [53].
Figure 7
Figure 7
The influence of the parameter values on the calculated dose-response curve. Sensitivity analysis of the calculated relative cell concentration expressed as the ratio of inhibitor-present to inhibitor-free cell concentration of Mycobacterium tuberculosis after an 8-day growth period as a function of 5'-O-(N-salicylsulfamoyl) adenosine (sAMS) concentration. The analysis was performed for the (A) intracellular MbtA-enzyme concentration [E]; (B) apparent reaction rate constant formula image; (C) upper limit of glycerol uptake rate formula image; (D) upper limit of glycerol uptake rate formula image
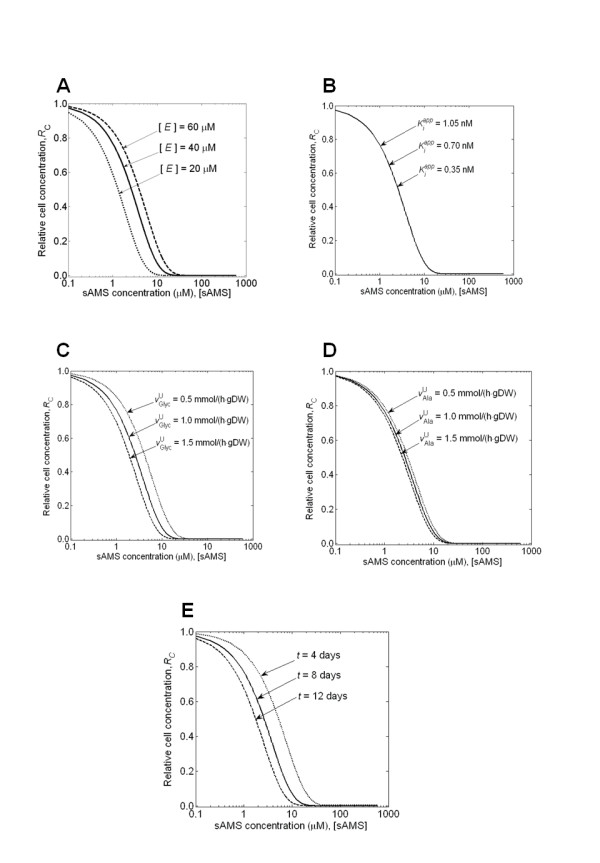
; and (E) time length of cellular growth t, which were each set to its original parameter value (solid line), the value increased by 50% (dashed line), and decreased by 50% (dotted line).

References

    1. Ideker T, Galitski T, Hood L. A new approach to decoding life: systems biology. Annu Rev Genomics Hum Genet. 2001;2:343–372. doi: 10.1146/annurev.genom.2.1.343. - DOI - PubMed
    1. Kell DB. Systems biology, metabolic modelling and metabolomics in drug discovery and development. Drug Discov Today. 2006;11:1085–1092. doi: 10.1016/j.drudis.2006.10.004. - DOI - PubMed
    1. Hornberg JJ, Bruggeman FJ, Westerhoff HV, Lankelma J. Cancer: a Systems Biology disease. Biosystems. 2006;83:81–90. doi: 10.1016/j.biosystems.2005.05.014. - DOI - PubMed
    1. Cho CR, Labow M, Reinhardt M, van Oostrum J, Peitsch MC. The application of systems biology to drug discovery. Curr Opin Chem Biol. 2006;10:294–302. doi: 10.1016/j.cbpa.2006.06.025. - DOI - PubMed
    1. Joyce AR, Palsson BO. Toward whole cell modeling and simulation: comprehensive functional genomics through the constraint-based approach. Prog Drug Res. 2007;64:267–309. - PubMed

Publication types

MeSH terms

LinkOut - more resources