. 2009 Nov 20;284(47):32551-61.
doi: 10.1074/jbc.M109.040501. Epub 2009 Sep 15.

Different strategies adopted by K(b) and L(d) to generate T cell specificity directed against their respective bound peptides

Affiliations

Different strategies adopted by K(b) and L(d) to generate T cell specificity directed against their respective bound peptides

Natalie A Bowerman et al. J Biol Chem. .

Abstract

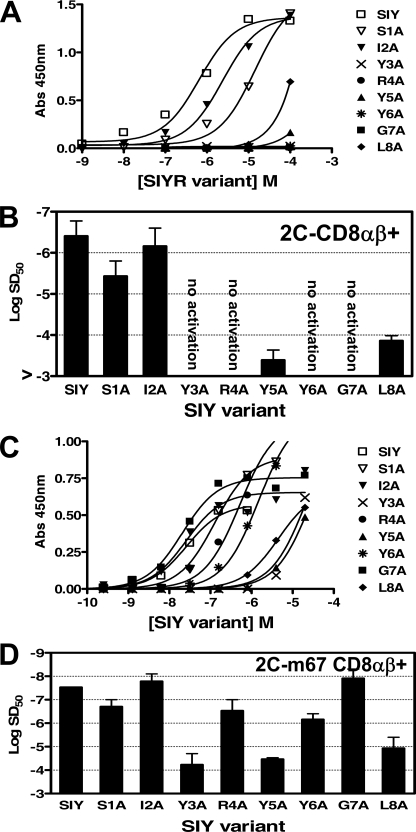
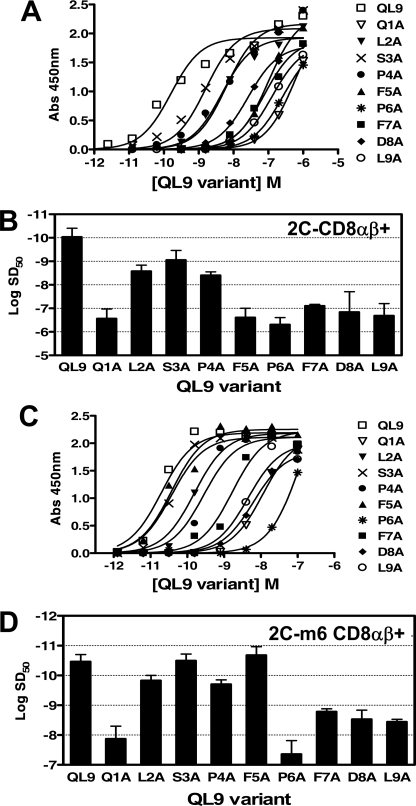
Mouse T cell clone 2C recognizes two different major histocompatibility (MHC) ligands, the self MHC K(b) and the allogeneic MHC L(d). Two distinct peptides, SIY (SIYRYYGL) and QL9 (QLSPFPFDL), act as strong and specific agonists when bound to K(b) and L(d), respectively. To explore further the mechanisms involved in peptide potency and specificity, here we examined a collection of single amino acid peptide variants of SIY and QL9 for 1) T cell activity, 2) binding to their respective MHC, and 3) binding to the 2C T cell receptor (TCR) and high affinity TCR mutants. Characterization of SIY binding to MHC K(b) revealed significant effects of three SIY residues that were clearly embedded within the K(b) molecule. In contrast, QL9 binding to MHC L(d) was influenced by the majority of peptide side chains, distributed across the entire length of the peptide. Binding of the SIY-K(b) complex to the TCR involved three SIY residues that were pointed toward the TCR, whereas again the majority of QL9 residues influenced binding of TCRs, and thus the QL9 residues had impacts on both L(d) and TCR binding. In general, the magnitude of T cell activity mediated by a peptide variant was influenced more by peptide binding to MHC than by binding the TCR, especially for higher affinity TCRs. Findings with both systems, but QL9-L(d) in particular, suggest that many single-residue substitutions, introduced into peptides to improve their binding to MHC and thus their vaccine potential, could impair T cell reactivity due to their dual impact on TCR binding.


Figures

FIGURE 1.
FIGURE 1.
Structural features of the 2C/SIY-Kb and 2C/QL9-Ld complexes, focusing on peptides SIY and QL9. A, side view of the 2C-SIY-Kb complex (Protein Data Bank code 1G6R). Peptide SIY (SIYRYYGL) is represented in orange. The Vα and Vβ domains of 2C TCR are represented in red and blue, respectively. Mouse class I MHC Kb is represented in green. B, side view of the 2C-QL9-Ld complex (Protein Data Bank code 2Oi9). Peptide QL9 (QLSPFPFDL) is represented in orange. The Vα and Vβ domains of 2C TCR are represented in red and blue, respectively. Mouse class I MHC Ld is represented in green.
FIGURE 2.
FIGURE 2.
Activation of wild type 2C or high affinity mutant T cell transfectants with peptide SIY alanine variants. A, the 2C T cell transfectant (CD8αβ+) was stimulated in the presence of T2-Kb and various concentrations of peptide SIY (SIYRYYGL) alanine variants. Activation was measured by assaying for levels of cytokine IL-2 release in an enzyme-linked immunosorbent assay. B, sensitization doses, SD50, determined from non-linear regression of the activation curves in A. Error bars, S.D. values averaged from four independent experiments. C, the m67 T cell transfectant (CD8αβ+) was stimulated in the presence of T2-Kb and various concentrations of peptide SIY alanine variants. D, SD50 values determined from non-linear regression of the activation curves in C. Error bars, S.D. values averaged from four independent experiments.
FIGURE 3.
FIGURE 3.
Activation of wild type 2C or high affinity mutant T cell transfectants with peptide QL9 alanine variants. A, the 2C T cell transfectant (CD8αβ+) was stimulated in the presence of T2-Ld and various concentrations of peptide QL9 (QLSPFPFDL) alanine variants. B, sensitization doses, SD50, determined from non-linear regression of the activation curves in A. Error bars, S.D. values averaged from two independent experiments. C, the m6 T cell transfectant (CD8αβ+) was stimulated in the presence of T2-Ld and various concentrations of peptide QL9 alanine variants. D, SD50 values determined from non-linear regression of the activation curves in C. Error bars, S.D. values averaged from two independent experiments.
FIGURE 4.
FIGURE 4.
Analysis of SIY and alanine variants binding to MHC Kb. A, detection of MHC Kb up-regulation on the surface of RMA-S with the addition of peptide SIY (SIYRYYGL) alanine variants. Levels of MHC Kb were detected with anti-Kb antibody B.8.24.3 and flow cytometry. MFU or the fluorescence signal above a no peptide background were plotted against peptide concentration. B, binding doses, BD50, determined from non-linear regression of the stabilization curves in A. BD50 values represent the concentration of peptide required to up-regulate half-maximal MHC Kb complexes. Error bars, S.D. values averaged from two independent experiments. C, levels of peptide SIY and alanine variants in complex with MHC Kb on the surface of T2-Kb were monitored at the indicated time points by detection with soluble tetrameric 2C-m67 coupled to streptavidin-phycoerythrin, and binding was detected with flow cytometry. Data are plotted as percentage of maximal peptide-MHC, which represents the percentage of peptide-Kb remaining on the cell surface at a specific time. Percentage of maximal peptide Kb = ((MFUsample − MFUnull OVA)/(Max MFUsample − MFUnull OVA)) × 100.
FIGURE 5.
FIGURE 5.
Analysis of QL9 and alanine variants binding to MHC Ld. A, detection of MHC Ld up-regulation on the surface of T2-Ld with the addition of peptide QL9 (QLSPFPFDL) and alanine variants. Levels of MHC Ld were detected with anti-Ld antibody 30-5-7 and flow cytometry. MFU values, or the fluorescence signal above a no peptide background, were plotted against peptide concentration. B, binding doses, BD50, determined from non-linear regression of the stabilization curves in A. BD50 values represent the concentration of peptide required to up-regulate half-maximal MHC Ld complexes. Error bars, S.D. values averaged from two independent experiments.
FIGURE 6.
FIGURE 6.
Analysis of peptide SIY and QL9 alanine variants binding to high affinity 2C TCRs m67 and m6. A, titrations of T2-Kb pulsed with 10 μm peptide SIY (SIYRYYGL) alanine variants and various concentrations of soluble biotinylated 2C TCR m67. Binding was detected with streptavidin-phycoerythrin and flow cytometry. MFU values, or fluorescence intensity above a no peptide background, were converted to percentage of maximal TCR binding as follows, % maximal TCR binding = (MFUsample/MFUmax) × 100. B, ΔΔG, determined from the binding constants (KD) in A. Error bars, S.D. values averaged from two independent experiments (no calculated S.D. is shown for SIY R4A because no binding was detected in one of the experiments). C, titrations of T2-Ld pulsed with 10 μm peptide QL9 (QLSPFPFDL) alanine variants along with various concentrations of soluble biotinylated 2C TCR m6. D, ΔΔG, determined from the binding constants (KD) shown in C. Error bars, S.D. values averaged from two independent experiments.
FIGURE 7.
FIGURE 7.
Peptide SIY and QL9 contact maps representing the number of atomic interactions with TCR and MHC. A, contact map represents number of atomic interactions between each residue of peptide SIY (SIYRYYGL) and either the 2C TCR or MHC Kb using the structure of 2C-SIY-Kb (Protein Data Bank code 1G6R). Interactions were determined using the program “Contacts” of the Collaborative Computational Project Number 4 (CCP4 Suite). An interaction was defined as two atoms involved in hydrogen bonds or van der Waals with atomic distances of ≤4.5 Å. B, contact map represents the number of atomic interactions between each residue of peptide QL9 (QLSPFPFDL) and the 2C TCR or the MHC Ld using the structure of 2C/QL9-Ld (Protein Data Bank code 2Oi9). C, contact map represents the number of atomic interactions between each residue of peptide QL9 and the high affinity 2C-m6 TCR or MHC Ld using the structure of m6/QL9-Ld (Protein Data Bank code 2E7L).
FIGURE 8.
FIGURE 8.
Structural features of SIY and QL9 peptide residues that appear to act indirectly on binding by the TCR. A, position of peptide SIY residue Tyr3 (orange) in the 2C TCR-SIY-Kb complex (Protein Data Bank code 1G6R). A portion of the Vα domain of the 2C TCR is represented in red, showing CDR1α residue Tyr-31. Class I MHC Kb is represented in green, showing residues Glu-152 and Arg-155. B, position of peptide QL9 residue Gln-1 (orange) in the m6 TCR-QL9 Gln-1-Ld complex (Protein Data Bank code 2E7L). A portion of the Vα domain of the 2C TCR is represented in red, showing CDR1α residues Thr-29 and Tyr-31. The class I MHC Ld is represented in green, showing residues Tyr-159 and Glu-163.

References

    1. Davis M. M., Bjorkman P. J. (1988) Nature 334, 395–402 - PubMed
    1. Wucherpfennig K. W., Allen P. M., Celada F., Cohen I. R., De Boer R., Garcia K. C., Goldstein B., Greenspan R., Hafler D., Hodgkin P., Huseby E. S., Krakauer D. C., Nemazee D., Perelson A. S., Pinilla C., Strong R. K., Sercarz E. E. (2007) Semin. Immunol. 19, 216–224 - PMC - PubMed
    1. Felix N. J., Donermeyer D. L., Horvath S., Walters J. J., Gross M. L., Suri A., Allen P. M. (2007) Nat. Immunol. 8, 388–397 - PubMed
    1. Iero M., Filipazzi P., Castelli C., Belli F., Valdagni R., Parmiani G., Patuzzo R., Santinami M., Rivoltini L. (2009) Cancer Immunol. Immunother. 58, 1159–1167 - PMC - PubMed
    1. Borbulevych O. Y., Baxter T. K., Yu Z., Restifo N. P., Baker B. M. (2005) J. Immunol. 174, 4812–4820 - PMC - PubMed

Publication types