. 2009 Nov 6;284(45):31028-37.
doi: 10.1074/jbc.M109.052712. Epub 2009 Sep 15.

The alphabeta T cell receptor is an anisotropic mechanosensor

Affiliations

The alphabeta T cell receptor is an anisotropic mechanosensor

Sun Taek Kim et al. J Biol Chem. .

Abstract

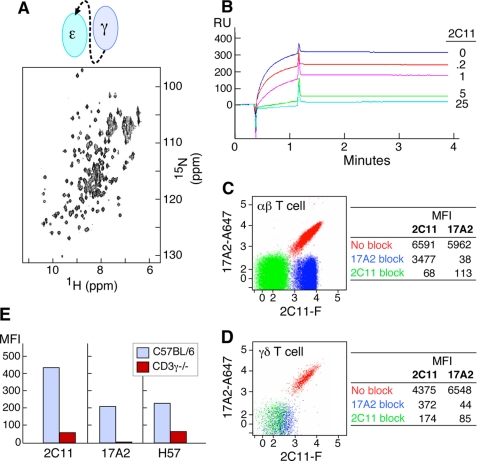
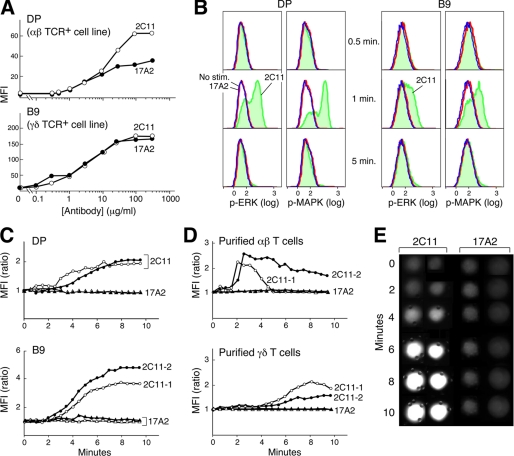
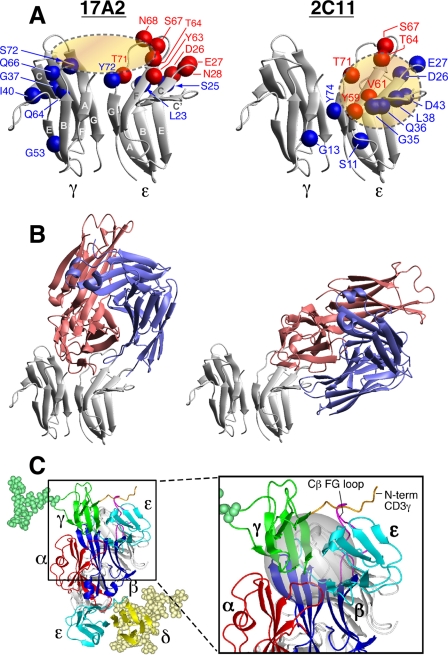
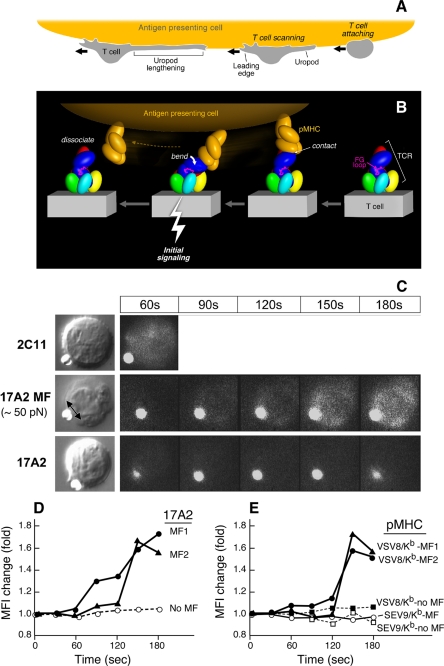
Thymus-derived lymphocytes protect mammalian hosts against virus- or cancer-related cellular alterations through immune surveillance, eliminating diseased cells. In this process, T cell receptors (TCRs) mediate both recognition and T cell activation via their dimeric alphabeta, CD3 epsilon gamma, CD3 epsilon delta, and CD3 zeta zeta subunits using an unknown structural mechanism. Here, site-specific binding topology of anti-CD3 monoclonal antibodies (mAbs) and dynamic TCR quaternary change provide key clues. Agonist mAbs footprint to the membrane distal CD3 epsilon lobe that they approach diagonally, adjacent to the lever-like C beta FG loop that facilitates antigen (pMHC)-triggered activation. In contrast, a non-agonist mAb binds to the cleft between CD3 epsilon and CD3 gamma in a perpendicular mode and is stimulatory only subsequent to an external tangential but not a normal force ( approximately 50 piconewtons) applied via optical tweezers. Specific pMHC but not irrelevant pMHC activates a T cell upon application of a similar force. These findings suggest that the TCR is an anisotropic mechanosensor, converting mechanical energy into a biochemical signal upon specific pMHC ligation during immune surveillance. Activating anti-CD3 mAbs mimic this force via their intrinsic binding mode. A common TCR quaternary change rather than conformational alterations can better facilitate structural signal initiation, given the vast array of TCRs and their specific pMHC ligands.


Figures

FIGURE 1.
FIGURE 1.
Specificity of anti-CD3 mAbs. A, 15N-1H two-dimensional HSQC spectrum of recombinant CD3ϵγ (schematically represented) is stable under physiological conditions (pH 7.4, phosphate-buffered saline). B, SPR analysis of competitive scCD3ϵγ binding between 17A2 and 2C11. Direct binding between recombinant CD3ϵγ (1 μm) and surface-bound 17A2 was measured using a BIA3000 Biosensor. Sensorgrams without and with 2C11 pre-addition to the CD3ϵγ protein are shown (numbers represent antibody to CD3ϵγ protein molar ratios). C and D, binding competition between 17A2 and 2C11 on the T cell surface. LNs were isolated from C57BL/6 mice. mAbs against T cell surface markers including CD3 were used for flow cytometric analysis. Each dot represents 2C11-FITC (2C11-F) and 17A2-Alexa 647 (17A2-A647) binding after unlabeled 17A2 blocking (blue), 2C11 blocking (green), or no blocking (red). CD4 single-positive αβ TCR-positive or γδ TCR-positive populations were gated for analysis. Data are representative of three independent experiments and plotted on a 5 log scale (0–5). MFI values are given in the tables for binding of each fluorochrome-labeled antibody without or with the indicated unlabeled mAb blockade. E, differential binding of 17A2 to thymocytes of wild type (blue) and CD3γ−/− (red) mice. CD4 single-positive thymocytes were gated for analysis. H57 recognizes the FG loop in the constant region of TCRβ (24).
FIGURE 2.
FIGURE 2.
Differential functional activation of T cells by anti-CD3 mAbs. A, flow cytometry analysis with MFI binding quantitation of 2C11-FITC and 17A2-FITC at varying concentrations to DP (αβ TCR+) and B9 (γδ TCR+) cell lines. B, phosphorylation states of ERK or MAPK after 2C11- or 17A2-coupled bead stimulation (blue = no stimulation; red = 17A2 stimulation; green = 2C11 stimulation). C and D, intracellular calcium dynamics upon interaction with 2C11- or 17A2-coupled beads. Circles represent cells stimulated by 2C11 beads and triangles represent cells stimulated by 17A2 beads (two independent measurements are shown for each with open and filled symbols). For calcium flux experiments, γδ and αβ T cells were purified from LNs of TCRβ−/− and CL57BL/6 mice, respectively, as described. Time 0 = time of bead addition to cells. E, microscopic images of calcium flux in individual cells using Fluo-4 and microscopy as described under “Experimental Procedures.” Fluo-4 responses were quantified by determining the average intensity of a region within each cell as a function of time using the Image J program (NIH). Results are representative of the 64 individual T cells analyzed. Two-tailed t test analysis was performed to compare MFI values from 64 T cells. The increase in intracellular free calcium levels induced by 2C11 beads was significantly different from those induced by 17A2 beads (i.e. p < 0.05 at 6 min).
FIGURE 3.
FIGURE 3.
NMR cross-saturation experiments to map antibody binding surfaces on CD3ϵγ and TCR quaternary structure. A, the residues in the binding sites of CD3ϵγ for 17A2 (left) and 2C11 (right) Fabs were mapped using cross-saturation analysis. Blue and red spheres indicate residues that experience significant cross-saturation (signal reduction < 0.5) or disappear upon Fab binding, respectively, and thus mediate direct contact with the Fabs. B, representative models of CD3ϵγ/17A2 Fab and CD3ϵγ/2C11 Fab complexes as described in the text. Red represents the heavy chain fragments and blue the light chain of the Fab. C, proposed TCR quaternary structure model as viewed from the T cell membrane. Magnified boxed region in the complex model shows the location of the Cβ FG loop (magenta) and N-terminal segment of CD3γ (orange) with the Cβ/Cα cave (24) represented as a gray sphere. For simplicity, only CD3γ (green) and CD3δ (yellow) glycans are shown. Hypothetical distance constraints between nearby charged residues were employed with a number of residues, including the entire N-terminal segment of CD3ϵ, which was allowed to be flexible during annealing between the docking steps.
FIGURE 4.
FIGURE 4.
Mechanosensor model for TCR signaling. A, T cell scanning an APC surface in search of specific pMHC. Upon attachment, the T cell assumes a polarized morphology with a leading edge and lengthening uropod. B, one pMHC molecule is shown in orange on the APC, whereas the ectodomains of TCR subunits on the T cell membrane below are colored as described in the legend to Fig. 3. The view is from the CD3ϵγ side. Initial ligation of the TCR by pMHC (right) constitutes a detachable mechanosensor that, as a result of continued T cell scanning, transmits an external torque (bend) into initial signaling (bolt) via the rigid components of the TCR complex prior to dissociation. The β FG loop is shown in magenta. C, calcium flux in naïve T cells after application of external mechanical force using optical tweezers. Equivalent amounts of Alexa 555-labeled 17A2 or 2C11 were immobilized on protein G-coupled polystyrene beads (1 μm diameter). T cell-bead contact was manipulated via the trapping beam as shown in bright field images (left panel). The direction of the external mechanical force (MF) for a 17A2 bead is denoted by the double-headed arrow. Microscopic fluorescence images were recorded using a 532-nm laser for both Alexa 555 and calcium orange (cellular dye for detecting calcium flux) under a temperature control at 37 °C (right panels). For 2C11 beads, the 60-s point only is shown, given the rapidity of calcium flux and the absence of a requirement of any additional MF. The fluorescent antibody-bound bead is the smaller object next to the T cell in every frame. D, quantitative intracellular calcium dynamics upon 17A2 bead interaction. Results are representative of 112 cellular N15 T cell events quantitated in eight separate experiments. Two-tailed t test was performed to compare MFI values of all cells between the 150- and 180-s intervals. Only 17A2 bead with applied tangential mechanical force significantly induces the intracellular calcium flux (p < 0.05). Three representative T cells are shown; two receiving ∼50 pN mechanical force (MF1/2) and one without (No MF). E, calcium dynamics upon pMHC bead interaction. Equivalent numbers (∼1,000) of VSV8/Kb and SEV9/Kb complexes were immobilized on streptavidin-coupled polystyrene beads (1 μm diameter). Tangential mechanical force (∼50 pN) was provided for each of three pMHC beads (pMHC MF) but not two others (no MF). Five representative cells are shown among 190 cell determinations analyzed. Only VSV8/Kb beads upon MF application induced significant calcium flux (p < 0.05) when ∼10 and ∼1,000 pMHC complexes per bead were examined. The extent of calcium flux was not diminished at the lower pMHC complex density nor kinetics of activation lengthened.

References

    1. Rudolph M. G., Stanfield R. L., Wilson I. A. (2006) Annu. Rev. Immunol. 24, 419–466 - PubMed
    1. Iwashima M., Irving B. A., van Oers N. S., Chan A. C., Weiss A. (1994) Science 263, 1136–1139 - PubMed
    1. Shinkai Y., Ma A., Cheng H. L., Alt F. W. (1995) Immunity 2, 401–411 - PubMed
    1. Sprent J., Surh C. D. (2002) Annu. Rev. Immunol. 20, 551–579 - PubMed
    1. Teixeiro E., Daniels M. A., Hamilton S. E., Schrum A. G., Bragado R., Jameson S. C., Palmer E. (2009) Science 323, 502–505 - PubMed

Publication types

MeSH terms

Substances