. 2010 Jan;139(1):85-97.
doi: 10.1530/REP-09-0300.

Hypoxia inducible factors regulate pluripotency and proliferation in human embryonic stem cells cultured at reduced oxygen tensions

Affiliations

Hypoxia inducible factors regulate pluripotency and proliferation in human embryonic stem cells cultured at reduced oxygen tensions

Catherine E Forristal et al. Reproduction. 2010 Jan.

Abstract

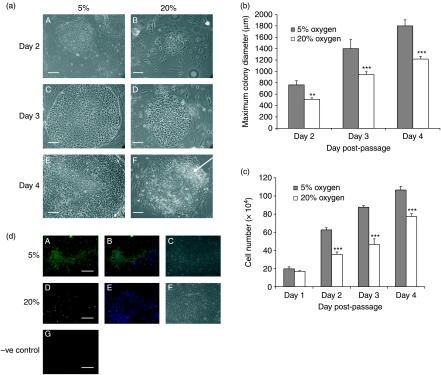
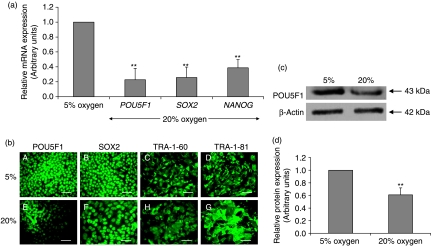
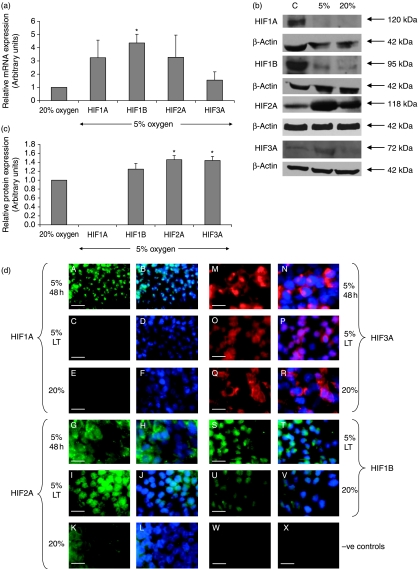
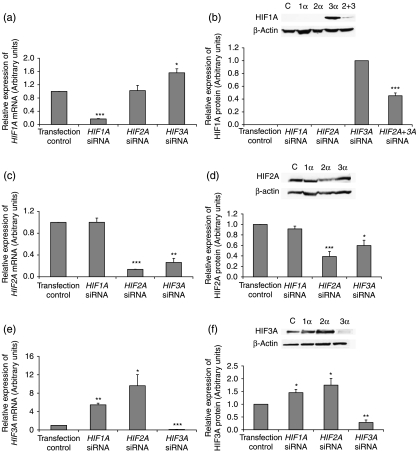
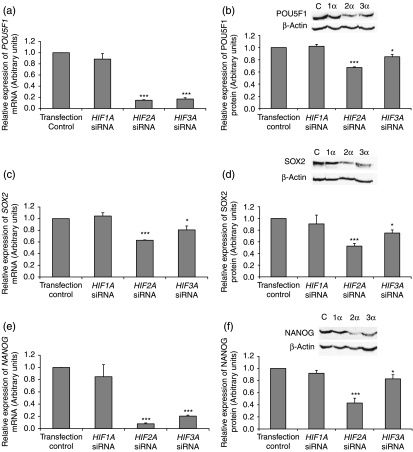
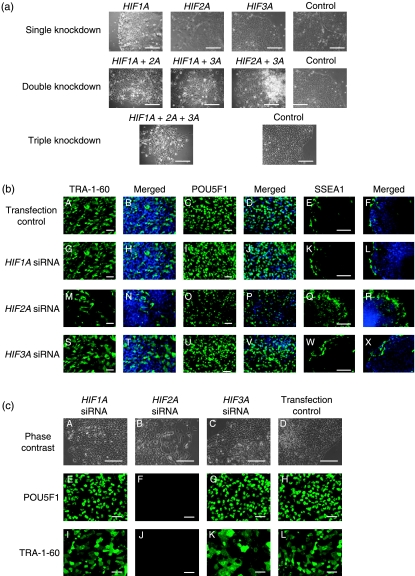
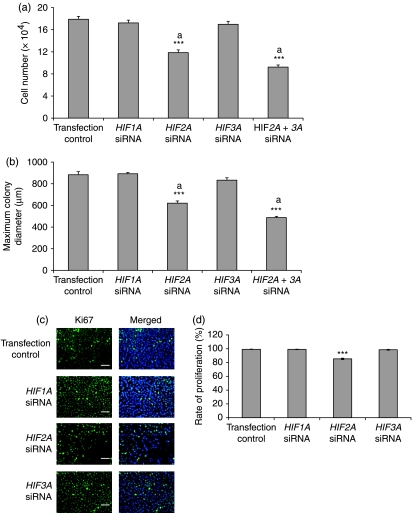
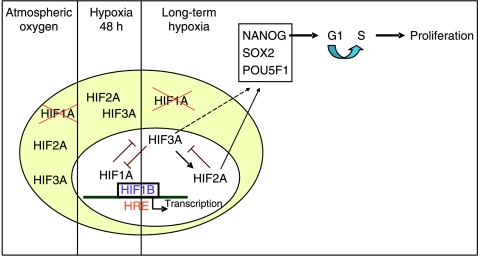
Human embryonic stem (hES) cells are routinely cultured under atmospheric, 20% oxygen tensions but are derived from embryos which reside in a 3-5% oxygen (hypoxic) environment. Maintenance of oxygen homeostasis is critical to ensure sufficient levels for oxygen-dependent processes. This study investigates the importance of specific hypoxia inducible factors (HIFs) in regulating the hypoxic responses of hES cells. We report that culture at 20% oxygen decreased hES cell proliferation and resulted in a significantly reduced expression of SOX2, NANOG and POU5F1 (OCT4) mRNA as well as POU5F1 protein compared with hypoxic conditions. HIF1A protein was not expressed at 20% oxygen and displayed only a transient, nuclear localisation at 5% oxygen. HIF2A (EPAS1) and HIF3A displayed a cytoplasmic localisation during initial hypoxic culture but translocated to the nucleus following long-term culture at 5% oxygen and were significantly upregulated compared with cells cultured at 20% oxygen. Silencing of HIF2A resulted in a significant decrease in both hES cell proliferation and POU5F1, SOX2 and NANOG protein expression while the early differentiation marker, SSEA1, was concomitantly increased. HIF3A upregulated HIF2A and prevented HIF1A expression with the knockdown of HIF3A resulting in the reappearance of HIF1A protein. In summary, these data demonstrate that a low oxygen tension is preferential for the maintenance of a highly proliferative, pluripotent population of hES cells. While HIF3A was found to regulate the expression of both HIF1A and HIF2A, it is HIF2A which regulates hES cell pluripotency as well as proliferation under hypoxic conditions.


Figures

Figure 1
Figure 1
(a) Phase contrast images of Hues 7 hES colonies cultured on MEFs under 5% (A, C and E) and 20% (B, D and F) oxygen on days 2 (A and B), 3 (C and D) and 4 (E and F) post-passage. Area of differentiation highlighted with arrow. Scale bar, 500 μm. (b) Average maximum hES cell colony diameter at 5 and 20% oxygen on days 2–4 post-passage **P<0.01, ***P<0.001 significantly different from 5% oxygen (n=6 for each day). (c) Average hES cell number at 5% and 20% oxygen on days 1–4 post-passage. Cell numbers were normalised on day 0 by passaging equal numbers of cells under both oxygen tensions. ***P<0.001 significantly different from 5% oxygen (n=21 for each day). (d) Ki67 (green) and DAPI (blue) labelling of Hues 7 hES cells at 5% (A–C) and 20% (D–F) oxygen on day 3 post-passage, phase contrast (C and F). Negative control, secondary antibody only (G). Scale bar, 250 μm.
Figure 2
Figure 2
(a) mRNA expression of POU5F1, SOX2 and NANOG cultured under 5% and 20% oxygen using relative quantification real-time RT-PCR. All data have been normalised to UBC and to 1 for 5% oxygen **P<0.01 (n=6). (b) Immunocytochemistry of POU5F1 (A and E), SOX2 (B and F), TRA-1-60 (C and H) and TRA-1-81 (D and G) of hES cells cultured under 5% (A–D) and 20% (E–H) oxygen. Scale bar=100 μm. (c) Representative western blot of POU5F1 expression in hES cells cultured under 5% and 20% oxygen. (d) Quantification of POU5F1 western blots. Data were normalised to β-actin and to 1 for 5% oxygen. **P<0.01 significantly different to 5% oxygen (n=3).
Figure 3
Figure 3
(a) mRNA expression of HIFs in hES cells at 5% and 20% oxygen. All data have been normalised to UBC and to 1 for 20% oxygen. *P<0.05 significantly different to 20% oxygen (n=3). (b) Representative western blots of HIFs after long-term culture at 5% or 20% oxygen (C) represents positive control protein. (c) Quantification of HIF western blots. Data were normalised to β-actin and to 1 for 20% oxygen. *P<0.05 significantly different to 20% oxygen (n=3). (d) Protein expression of HIFs by immunocytochemistry in hES cells cultured under 5% oxygen for 48 h (5% 48 h; A and B, G and H, M and N), 5% oxygen for long-term (5% LT=more than three passages; C and D, I and J, O and P, S and T) and 20% oxygen (E and F, K and L, Q and R, U and V). HIF1A (green; A–F), HIF2A (green; G–L), HIF3 (red; M–R) and HIF1A (green; S–V). DAPI (blue). Negative controls=FITC secondary only (W) and Texas Red secondary only (X). Scale bar=40 μm.
Figure 4
Figure 4
mRNA expression levels of (a) HIF1A, (c) HIF2A and (e) HIF3A when each HIF-α isoform was silenced in hES cells cultured under 5% oxygen for 48 h. All data has been normalised to UBC and to 1 for the transfection control. *P<0.05, **P<0.01, ***P<0.001 significantly different to transfection control (n=3). (b) Representative HIF1A protein expression and quantification when HIF2A and HIF3A were silenced separately and simultaneously. *** P<0.001 significantly different to HIF3A siRNA. Representative (d) HIF2A and (f) HIF3A protein expression and quantification when each HIF-α isoform was silenced *P<0.05, **P<0.01, *P<0.001 significantly different to transfection control (n=3). Protein was collected for all samples 48 h post-transfection.
Figure 5
Figure 5
mRNA expression levels of (a) POU5F1, (c) SOX2 and (e) NANOG when HIF-α subunits were silenced in hES cells cultured under 5% oxygen for 48 h. Data normalised to UBC and to 1 for the transfection control. *P<0.05, ***P<0.001 significantly different to transfection control (n=3). Representative (b) POU5F1, (d) SOX2 and (f) NANOG protein expression and quantification by western blotting when HIF-α subunits were silenced. *P<0.05, ***P<0.001 significantly different to transfection control (n=3). Protein was collected for all samples 48 h post-transfection.
Figure 6
Figure 6
(a) Representative phase contrast images of hES cells cultured under 5% oxygen 48 h after transfection with HIF-α siRNA. Controls contain the same volume and concentration of transfection reagent and AllStars control siRNA as each of the knockdowns. Scale bar=100 μm. (b) Protein expression of pluripotency markers TRA-1-60 (A, G, M and S), merged with DAPI (B, H, N and T), POU5F1 (C, I, O and U), merged with DAPI (D, J, P and V) and differentiation marker SSEA1 (E, K, Q and W), merged with DAPI (F, L, R and X) in hES cells 48 h following siRNA transfection of HIF-α subunits. Scale bar=100 μm. (c) Phase contrast and protein expression of POU5F1 and TRA-1-60 in hES cells two passages following HIF-α gene silencing. Scale bar=100 μm.
Figure 7
Figure 7
Effect of silencing HIF-α subunits in hES cells cultured under 5% oxygen 48 h following siRNA transfection on average cell number (n=3). Cell numbers were normalised on day 0 by passaging an equal number of cells. (b) Effect of HIF-α silencing 48 h following siRNA transfection on average maximum colony diameter (n=6). ***P<0.001 significantly different from transfection control. Bars with the same superscript are significantly different; aP<0.01. (c) Ki67 (green) and DAPI (blue) labelling of HIF-α silenced hES cells and transfection control. Scale bar=100 μm. (d) Percentage of HIF-α silenced Ki67 positive hES cells. ***P<0.001 significantly different from transfection control.
Figure 8
Figure 8
A schematic representation of the HIF-α subunit localisation, regulation and effect on proliferation in hES cells cultured under atmospheric and hypoxic oxygen tensions.

References

    1. Bradford MM. A rapid and sensitive method for the quantitation of microgram quantities of protein utilizing the principle of protein-dye binding. Analytical Biochemistry. 1976;72:248–254. - PubMed
    1. Cameron CM, Harding F, Hu WS, Kaufman DS. Activation of hypoxic response in human embryonic stem cell-derived embryoid bodies. Experimental Biology and Medicine. 2008;233:1044–1057. - PubMed
    1. Chen HF, Kuo HC, Chen W, Wu FC, Yang YS, Ho HN. A reduced oxygen tension (5%) is not beneficial for maintaining human embryonic stem cells in the undifferentiated state with short splitting intervals. Human Reproduction. 2009;1:71–80. - PubMed
    1. Compernolle V, Brusselmans K, Acker T, Hoet P, Tjwa M, Beck H, Plaisance S, Dor Y, Keshet E, Lupu F, et al. Loss of HIF-2α and inhibition of VEGF impair fetal lung maturation, whereas treatment with VEGF prevents fatal respiratory distress in premature mice. Nature Medicine. 2002;8:702–710. - PubMed
    1. Covello KL, Kehler J, Yu H, Gordan JD, Arsham AM, Hu CJ, Labosky PA, Simon MC, Keith B. HIF-2α regulates Oct-4: effects of hypoxia on stem cell function, embryonic development, and tumor growth. Genes and Development. 2006;20:557–570. - PMC - PubMed

Publication types

MeSH terms