

Phosphate (Pi) starvation effect on the cytosolic Pi concentration and Pi exchanges across the tonoplast in plant cells: an in vivo 31P-nuclear magnetic resonance study using methylphosphonate as a Pi analog
- PMID: 19755536
- PMCID: PMC2773096
- DOI: 10.1104/pp.109.144626
Phosphate (Pi) starvation effect on the cytosolic Pi concentration and Pi exchanges across the tonoplast in plant cells: an in vivo 31P-nuclear magnetic resonance study using methylphosphonate as a Pi analog
Abstract
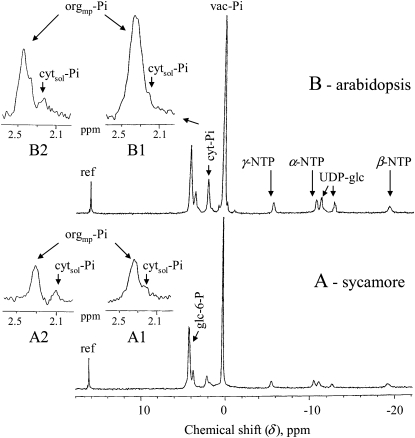
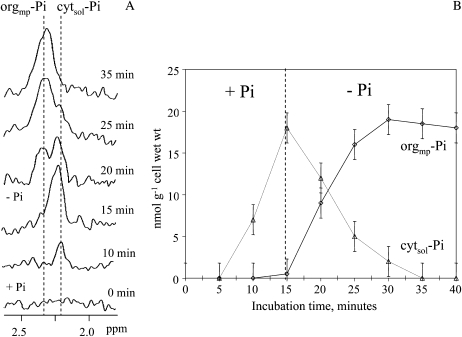
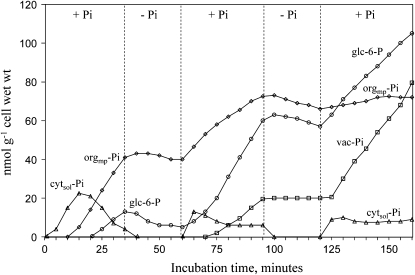
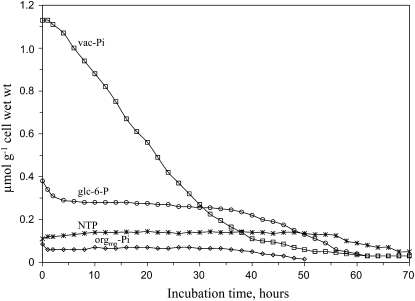
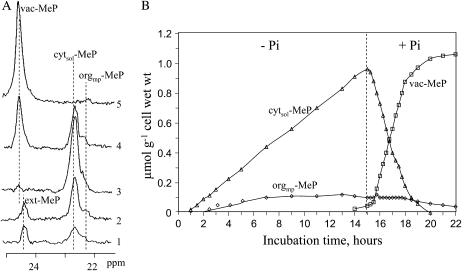
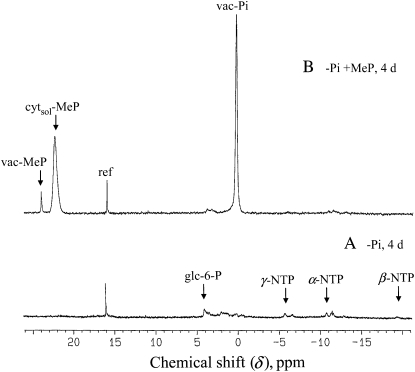
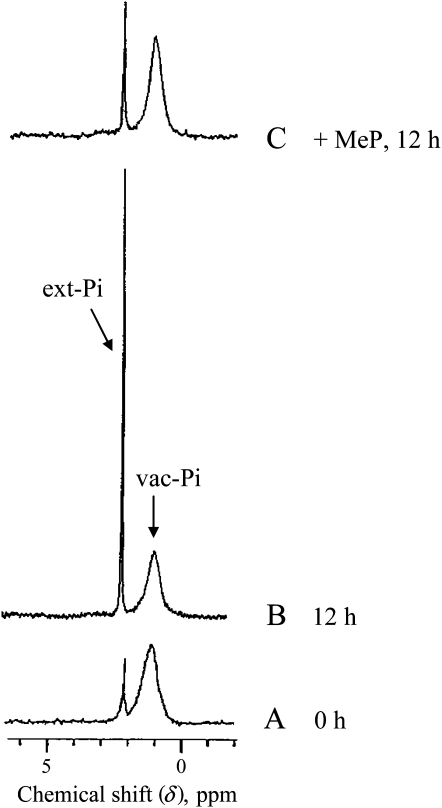
In vivo (31)P-NMR analyses showed that the phosphate (Pi) concentration in the cytosol of sycamore (Acer pseudoplatanus) and Arabidopsis (Arabidopsis thaliana) cells was much lower than the cytoplasmic Pi concentrations usually considered (60-80 mum instead of >1 mm) and that it dropped very rapidly following the onset of Pi starvation. The Pi efflux from the vacuole was insufficient to compensate for the absence of external Pi supply, suggesting that the drop of cytosolic Pi might be the first endogenous signal triggering the Pi starvation rescue metabolism. Successive short sequences of Pi supply and deprivation showed that added Pi transiently accumulated in the cytosol, then in the stroma and matrix of organelles bounded by two membranes (plastids and mitochondria, respectively), and subsequently in the vacuole. The Pi analog methylphosphonate (MeP) was used to analyze Pi exchanges across the tonoplast. MeP incorporated into cells via the Pi carrier of the plasma membrane; it accumulated massively in the cytosol and prevented Pi efflux from the vacuole. This blocking of vacuolar Pi efflux was confirmed by in vitro assays with purified vacuoles. Subsequent incorporation of Pi into the cells triggered a massive transfer of MeP from the cytosol to the vacuole. Mechanisms for Pi exchanges across the tonoplast are discussed in the light of the low cytosolic Pi level, the cell response to Pi starvation, and the Pi/MeP interactive effects.
Figures
Similar articles
-
Rice SPX-Major Facility Superfamily3, a Vacuolar Phosphate Efflux Transporter, Is Involved in Maintaining Phosphate Homeostasis in Rice.Plant Physiol. 2015 Dec;169(4):2822-31. doi: 10.1104/pp.15.01005. Epub 2015 Sep 30. Plant Physiol. 2015. PMID: 26424157 Free PMC article.
-
Early response of plant cell to carbon deprivation: in vivo 31P-NMR spectroscopy shows a quasi-instantaneous disruption on cytosolic sugars, phosphorylated intermediates of energy metabolism, phosphate partitioning, and intracellular pHs.New Phytol. 2011 Jan;189(1):135-47. doi: 10.1111/j.1469-8137.2010.03449.x. Epub 2010 Sep 3. New Phytol. 2011. PMID: 20819175
-
Relationship between the cytoplasm and the vacuole phosphate pool in Acer pseudoplatanus cells.Arch Biochem Biophys. 1983 Aug;225(1):143-8. doi: 10.1016/0003-9861(83)90017-6. Arch Biochem Biophys. 1983. PMID: 6614914
-
Pumping up the volume - vacuole biogenesis in Arabidopsis thaliana.Semin Cell Dev Biol. 2018 Aug;80:106-112. doi: 10.1016/j.semcdb.2017.07.008. Epub 2017 Jul 8. Semin Cell Dev Biol. 2018. PMID: 28694113 Review.
-
The plant vacuole: emitter and receiver of calcium signals.Cell Calcium. 2011 Aug;50(2):120-8. doi: 10.1016/j.ceca.2011.02.002. Epub 2011 Mar 4. Cell Calcium. 2011. PMID: 21376393 Review.
Cited by
-
A dual role of strigolactones in phosphate acquisition and utilization in plants.Int J Mol Sci. 2013 Apr 9;14(4):7681-701. doi: 10.3390/ijms14047681. Int J Mol Sci. 2013. PMID: 23612324 Free PMC article. Review.
-
Phosphorus homeostasis in Populus alba L. under excess phosphate conditions, assessed by 31P nuclear magnetic resonance spectroscopy and X-ray microfluorescence.Environ Sci Pollut Res Int. 2020 Jan;27(3):3320-3328. doi: 10.1007/s11356-019-07200-9. Epub 2019 Dec 14. Environ Sci Pollut Res Int. 2020. PMID: 31838696
-
Knockout of MULTI-DRUG RESISTANT PROTEIN 5 Genes Lead to Low Phytic Acid Contents in Oilseed Rape.Front Plant Sci. 2020 May 26;11:603. doi: 10.3389/fpls.2020.00603. eCollection 2020. Front Plant Sci. 2020. PMID: 32528494 Free PMC article.
-
Rice SPX-Major Facility Superfamily3, a Vacuolar Phosphate Efflux Transporter, Is Involved in Maintaining Phosphate Homeostasis in Rice.Plant Physiol. 2015 Dec;169(4):2822-31. doi: 10.1104/pp.15.01005. Epub 2015 Sep 30. Plant Physiol. 2015. PMID: 26424157 Free PMC article.
-
A simple and efficient method for the long-term preservation of plant cell suspension cultures.Plant Methods. 2012 Jan 30;8:4. doi: 10.1186/1746-4811-8-4. Plant Methods. 2012. PMID: 22289515 Free PMC article.
References
-
- Aubert S, Bligny R, Douce R (1996) NMR studies of metabolism in cell suspensions and tissue cultures. In Y Shachar-Hill, P Pfeffer, eds, Nuclear Magnetic Resonance in Plant Biology. American Society of Plant Physiologists, Rockville, MD, pp 109–144
-
- Aubert S, Gout E, Bligny R, Douce R (1994) Multiple effects of glycerol on plant cell metabolism. J Biol Chem 269 21420–21427 - PubMed
-
- Barber SA, Walker JM, Vasey EH (1963) Mechanisms for the movements of plant nutrients from the soil and fertilizer to the plant root. J Agric Food Chem 11 204–207
-
- Bieleski RL (1973) Phosphate pools, phosphate transport, and phosphate availability. Annu Rev Plant Physiol 24 225–252
-
- Bligny R, Douce R (1976) Les mitochondries de cellules végétales isolées (Acer pseudoplatanus L.). Physiol Veg 14 499–515
Publication types
MeSH terms
Substances
LinkOut - more resources
Full Text Sources
Research Materials
Miscellaneous
